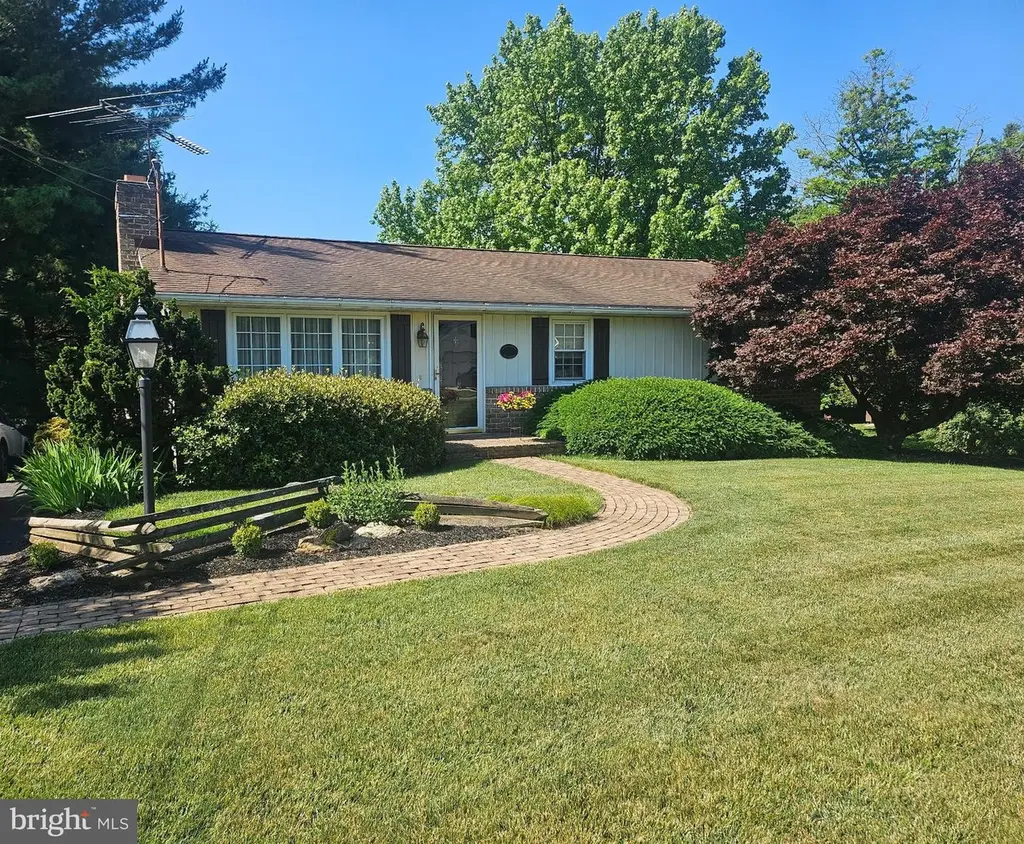
2381 Ridge Rd
Manheim, PA 17329
$315,000D
3 bd · 1.0 ba ·
1,092 sqft ·
Built 1975
· SingleFamily
· Active
· 1 DOM
Cashflow @ list (25.0% down · 7.5%)
Estimated rent
$2,017/mo
Mortgage (P&I)
−$1,652
Tax + insurance
−$489
HOA
−$0
Vac / Maint / Mgmt
−$424
Net cashflow
$-547/mo
Annual
$-6,569/yr
Cap rate
4.21%
Cash-on-cash
-7.45%
DSCR
0.67
1% rule
0.64%
Cash to close
$88,200
Investor read
- This is a 3-bed/1.0-bath single-family listed at $315k.
- At list price, monthly cash flow is $-547 ($-7k/yr) — negative.
- To cash-flow at today's rent, offer at most $218k (30.7% below list).
- To meet the 1% rule (rent ≥ 1% of price), the offer needs to be $202k (36.0% below list).
- Only 1 days on market — expect competitive offers; lowballing is unlikely to land.
- Recommended offer: $202k (36.0% below list) — sets the bar for 1% rule.
- In year one you build about $34k of equity ($2k loan paydown + $32k appreciation (10.0% local appreciation)).
- Location reads 79/100 on livability (#236 in PA, #2,155 nationally) — a middle-class / working-renter tenant base. Strengths: cost of living A+, housing A+, health & safety A+; Watch: amenities D+, commute F.
- South Western SD (suburban): math 37% / reading 56% proficiency, ranked #206 of 539 in PA (top 38%) — families likely to look elsewhere, expect single-tenant / working-renter base with shorter leases.
- Zoned schools: Manheim El Sch (math 42% / reading 62%, grade C-, #586 of 1,518 statewide, top 42%, 261 students, 30% FRL); Emory H Markle Ms (math 27% / reading 53%, grade F, #257 of 512 statewide, top 52%, 1,028 students, 34% FRL); South Western Shs (math 83% / reading 75%, grade A-, #20 of 437 statewide, top 4%, 1,299 students, 31% FRL).
- Market conditions: 13 active listings in the ZIP; 1,328 units permitted in York County in 2024 (338 in 5+ unit buildings).
- By year 2, paydown + projected appreciation supports a ~$54k cash-out refi (75% LTV) — recoverable capital for the next deal without selling this one.
- Climate carrying-cost: extreme-heat days projected 7→15/yr by 2055 (HVAC capex compounding) — expect insurance premiums to compound above CPI over the hold.
- Cap rate 4.2% vs local median 1.5% in Manheim — top-decile yield for the area; either an underpriced asset or a hidden risk that comps aren't pricing in. Stress-test before assuming the spread holds.
Questions for listing agent
- What do current leases actually rent for vs. the listed asking? Can we see a recent rent roll and the last 12 months of T-12 income?
- Built in 1975 — when were the roof, HVAC, electrical panel, plumbing, and water heater last replaced?
- Is there a deadline driving the sale (1031 exchange, divorce, estate, relocation)? That informs how much negotiation room exists.
- Schools are B-rated — typically a magnet for longer-tenancy family renters. What's the average tenant stay here, and is there a school-zone premium baked into asking?
- The area grade is low — what's the realistic commute time and amenity access for the typical tenant pool here? Any planned neighborhood developments (good or bad) we should know about?
- What's the average days-on-market for RENTAL listings here right now (not sales)? A rising rental-DOM trend means longer vacancies and softer asking-rent achievability than the comps imply.
- What's the recent tenant-quality profile in this submarket — average credit score on applications, eviction rate, late-payment / NSF rate, and stable-employment percentage? A property-management company in the area should have these aggregated.
- How much new for-sale + rental construction is in the pipeline within 1–3 miles? Heavy new supply typically softens prices + rents 12–24 months out; constrained supply supports both.
CashFlowRE · CFR-PF90VP76E0W5G6
· Data 1 day ago
cashflowre.app · 2026-05-29