2381 Ridge Rd · Manheim, PA
Flood risk 1/10 · Minimal
- FEMA flood zone
- X (unshaded)
- Chance of flooding over 30 yrs
- 0.0%
- Est. flood insurance / yr
- $473 – $860
Fire risk 3/10 · Minor
- Est. fire insurance / yr
- $511 – $949
Heat risk 5/10 · Moderate
- Hot days now (above 100°F)
- 7 days/yr
- Hot days in 30 yrs
- 15 days/yr
Wind risk 4/10 · Minor
- Chance of severe wind over 30 yrs
- 13.0%
Air-quality risk 3/10 · Minor
- Unhealthy air days now
- 2 days/yr
- Unhealthy air days in 30 yrs
- 4 days/yr
Risk factors via First Street. Map © Google.
Why this score? — see what drove the D grade
The composite is a weighted blend of 9 inputs, each scored 0–100. Each bar is that input's sub-score; the figure is the points it added to the 100-point composite (weight × sub-score).
- Appreciation +10.0/10.0
- ARV discount +9.1/15.0
- Cash flow +6.4/30.0
- Schools +4.2/10.0
- Livability +4.0/5.0
- Rent growth +2.5/5.0
- Condition / age +2.5/5.0
- 1% rule +1.4/10.0
- DSCR +0.7/10.0
$315,000
🖨 Deal sheet 📄 Offer letter ✓ Due diligence
Listing remarks
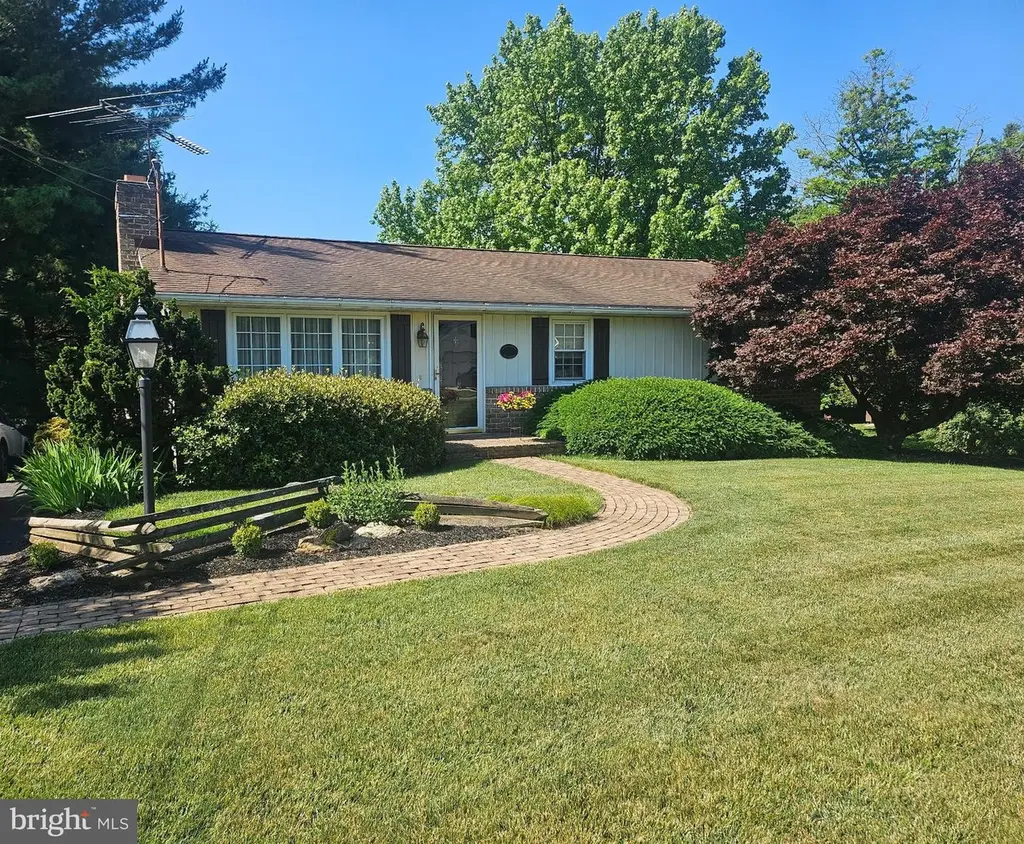
Nestled on a serene 1.36-acre lot, this exquisite ranch-style home offers a perfect blend of comfort and luxury in a tranquil rural setting. The exterior features extensive and beautifully landscaped gardens, creating an inviting atmosphere that beckons you to unwind. Enjoy the peaceful views of mature trees and a manicured lawn from your screened patio, ideal for morning coffee or evening gatherings. Step inside to discover a thoughtfully designed interior that exudes warmth and charm. The traditional layout includes three bedrooms and one full bath on main level and one full bath at basement level. The family room has a cozy brick fireplace, and seamlessly connects to the dining area, mak
Key facts
- Screened patio
- Brick fireplace
- Landscaped gardens
Tags
Property features AI
Finance
- Other: Basement walkout level, partially finished
Exterior
- Parking: Attached basement garage with rear entry and automatic door opener; One garage space; Asphalt private driveway; Driveway space for about 5 vehicles; Total of up to 6 garage/parking spaces
- Utilities: Well water; On-site septic system; Cable TV available; Electric service available; Phone service available
- Home design: Detached single-family home; Estimated year built; Not in a federal flood zone; Fee simple ownership; Excellent condition; Rural location; Paved road access
- Construction: Stick-built construction; Block foundation; Asphalt shingle roof; Double-hung, double-pane windows
- Exterior features: Gutter system; Kennels; Outbuilding(s); Screened patio/porch; Patio(s); Shed; Backs to trees; Front yard; Landscaped; Level lot; Partly wooded; Rear yard; Secluded setting; Vegetation plantings
Interior
- Kitchen: Dishwasher; Microwave; Electric oven/range
- Bedrooms: Three main-level bedrooms; Entry-level bedroom
- Flooring: Luxury vinyl plank; Tile/brick; Carpet
- Bathrooms: Two full bathrooms (main level)
- Heating & cooling: Baseboard heating (electric and hot water); Oil heating fuel; Central air conditioning; 200+ amp electric service; Electric hot water
- Interior features: Attic; Bathroom with walk-in shower; Built-ins; Chair railings; Combination kitchen/dining area; Exposed beams; Family room off kitchen; Traditional floor plan; Wood stove; Wainscoting; Storm door(s); Beamed ceilings; Drywall walls/ceilings; Wood walls
- Laundry & utility: Washer; Electric dryer; Basement laundry/utility area
Neighborhood map
What this means for you Summary
Snapshot
- This is a 3-bed/1.0-bath single-family listed at $315k.
Deal economics
- At list price, monthly cash flow is $-547 ($-7k/yr) — negative.
- To cash-flow at today's rent, offer at most $218k (30.7% below list).
- To meet the 1% rule (rent ≥ 1% of price), the offer needs to be $202k (36.0% below list).
- Recommended offer: $202k (36.0% below list) — sets the bar for 1% rule.
- Cap rate 4.2% vs local median 1.5% in Manheim — top-decile yield for the area; either an underpriced asset or a hidden risk that comps aren't pricing in. Stress-test before assuming the spread holds.
Location & tenants
- Location reads 79/100 on livability (#236 in PA, #2,155 nationally) — a middle-class / working-renter tenant base. Strengths: cost of living A+, housing A+, health & safety A+; Watch: amenities D+, commute F.
- South Western SD (suburban): math 37% / reading 56% proficiency, ranked #206 of 539 in PA (top 38%) — families likely to look elsewhere, expect single-tenant / working-renter base with shorter leases.
- Zoned schools: Manheim El Sch (math 42% / reading 62%, grade C-, #586 of 1,518 statewide, top 42%, 261 students, 30% FRL); Emory H Markle Ms (math 27% / reading 53%, grade F, #257 of 512 statewide, top 52%, 1,028 students, 34% FRL); South Western Shs (math 83% / reading 75%, grade A-, #20 of 437 statewide, top 4%, 1,299 students, 31% FRL).
- Market conditions: 13 active listings in the ZIP; 1,328 units permitted in York County in 2024 (338 in 5+ unit buildings).
Forward outlook
- In year one you build about $34k of equity ($2k loan paydown + $32k appreciation (10.0% local appreciation)).
- By year 2, paydown + projected appreciation supports a ~$54k cash-out refi (75% LTV) — recoverable capital for the next deal without selling this one.
Negotiation context
- Only 1 days on market — expect competitive offers; lowballing is unlikely to land.
Risks & watch-outs
- Climate carrying-cost: extreme-heat days projected 7→15/yr by 2055 (HVAC capex compounding) — expect insurance premiums to compound above CPI over the hold.
Questions for the listing agent
- What do current leases actually rent for vs. the listed asking? Can we see a recent rent roll and the last 12 months of T-12 income?
- Built in 1975 — when were the roof, HVAC, electrical panel, plumbing, and water heater last replaced?
- Is there a deadline driving the sale (1031 exchange, divorce, estate, relocation)? That informs how much negotiation room exists.
- Schools are B-rated — typically a magnet for longer-tenancy family renters. What's the average tenant stay here, and is there a school-zone premium baked into asking?
- The area grade is low — what's the realistic commute time and amenity access for the typical tenant pool here? Any planned neighborhood developments (good or bad) we should know about?
- What's the average days-on-market for RENTAL listings here right now (not sales)? A rising rental-DOM trend means longer vacancies and softer asking-rent achievability than the comps imply.
- What's the recent tenant-quality profile in this submarket — average credit score on applications, eviction rate, late-payment / NSF rate, and stable-employment percentage? A property-management company in the area should have these aggregated.
- How much new for-sale + rental construction is in the pipeline within 1–3 miles? Heavy new supply typically softens prices + rents 12–24 months out; constrained supply supports both.
Investment metrics
- 1% rule
- 0.64% ✗
- Cap rate
- 4.21%
- Cash-on-cash
- -7.45%
- DSCR
- 0.67
- GRM
- 13.0
CMA / ARV
- ARV (on-the-fly)
- $326,508
- Comps found
- 2
Show comp detail 2 sales within ~0.75 mi
| Address | Dist | Beds/Ba | Sqft | Sold | Price | $/sf | Match |
|---|---|---|---|---|---|---|---|
| 5566 Blue Hill Rd | 0.47mi | 3/1.0 | 1,121 (+3%) | 5mo | $254,000 | $227 | 69 |
| 3691 Hobart Rd | 0.39mi | 3/2.0 | 1,104 (+1%) | 13mo | $330,000 | $299 | 65 |
Match score weights: distance 35% · size 25% · config 20% · recency 20%. Top-matched comps best support the ARV.
Projected returns pro-forma
10.0% appreciation · 3.0% rent growth · sell at horizon
- IRR
- 19.0%
- Equity multiple
- 2.55×
- Total profit
- $136,698
- Equity at exit
- $283,777
- IRR
- 17.6%
- Equity multiple
- 5.88×
- Total profit
- $429,990
- Equity at exit
- $611,976
Cash invested: $88,200 (down + closing). Projections, not guarantees.
Landlord ↔ Tenant lean methodology
- Overall (STATE)
- 62 Landlord-Friendly
- State Pennsylvania
- 62 Landlord-Friendly · EVEN
- County
- — inherits STATE
- City
- — inherits STATE
ZIP-level market 17329
- Home prices YoY
- 7.8%
- Active inventory
- 13
- Price-to-rent
- 13.0×
Monthly cashflow live
- Estimated rent
- $2,017 medium interval (Pro) →
- Mortgage (P&I)
- −$1,652
- Tax from tax record
- −$358 /mo · $4,298/yr
- Insurance
- −$131
- HOA
- −$0
- Vacancy / Maint / Mgmt
- −$424
- Net cashflow
- $-547
Break-even live
UW: 25.0% down · 7.5% · 30yr · 1.5% tax · 5.0% vac · 8.0% maint · 8.0% mgmt
Financing live
Cash to close
- Down payment
- $78,750
- Closing costs
- $9,450
- Reserves months
- —
- Total cash needed
- —
Loan-product check · same deal, 3 products live
Conventional
25% down · 7.5% · 30yr
- Down + closing
- —
- Monthly P&I
- —
- Monthly cashflow
- —
- DSCR
- —
- Eligible?
- —
Personal DTI + credit; lowest rate.
DSCR
20% down · 8.5% · 30yr
- Down + closing
- —
- Monthly P&I
- —
- Monthly cashflow
- —
- DSCR
- —
- Eligible?
- —
No personal income docs; deal must DSCR.
Hard money
10% down · 12.0% · 12mo
- Down + closing
- —
- Monthly P&I
- —
- Monthly cashflow
- —
- DSCR
- —
- Eligible?
- —
Short-term bridge; refi at stabilization.
Listing history 7 events
-
2026-06-19statusdays on market $315,000 Active 1 DOM
-
2026-06-18days on market $315,000 Coming Soon 6 DOM
-
2026-06-17days on market $315,000 Coming Soon 5 DOM
-
2026-06-16days on market $315,000 Coming Soon 4 DOM
-
2026-06-15days on market $315,000 Coming Soon 3 DOM
-
2026-06-13remarks 699-char remark
-
2026-06-13$315,000 Coming Soon 1 DOM
ⓘ Source: listings_history table (triggers on properties + properties_extension) + one-shot
backfill from property_details.listing_events for pre-trigger history.
Tax reassessment forecast PA · Partial reset (capped growth)
- Current annual tax
- $4,298 · $358/mo
- Projected year-2 tax
- $4,637 · $386/mo
- Expected delta
- +$340/yr (+$28/mo · 7.9%)
ⓘ Screening estimate from a state-policy table — verify with the county assessor before closing.
Climate risk First Street
- Flood 1/10 Low FEMA zone X (unshaded) · 0% chance over 30 yrs
- Wildfire 3/10 Moderate
- Heat 5/10 Major 7 d/yr ≥100°F today · 15 d/yr by 30 yrs out
- Wind 4/10 Moderate 13% chance of damaging wind over 30 yrs
- Air quality 3/10 Moderate 2 unhealthy d/yr today · 4 by 30 yrs out
Nearby sold comps map
Loading sold comps map…
Walkable amenities ~0.75 mi
Loading nearby amenities…
Taxation est. · year 1
- Rental income
- $24,210
- − Mortgage interest
- −$17,645
- − Property taxes
- −$4,298
- − Insurance
- −$1,575
- − Repairs & maintenance
- −$1,937
- − Management
- −$1,937
- − Depreciation
- −$9,164
- Taxable loss
- −$12,345
- Est. tax savings @ 24.0%
- +$2,963
- After-tax cash flow
- $-3,607/yr
For passive investors: Depreciation is non-cash, so a rental often shows a tax loss while cash-flowing — sheltering income. Rental losses are passive: they offset passive income freely, and up to $25,000/yr can offset ordinary (W-2) income if you actively participate and your MAGI is under $100k (phasing out to $0 by $150k); unused losses carry forward. On sale, claimed depreciation is recaptured at up to 25%, and gains may owe capital-gains tax (a 1031 exchange can defer both). Figures are a year-1 estimate at your 24.0% rate — not tax advice; consult a CPA.
Schools (NCES district)
- District
- South Western SD
- NCES district ID
- 4222470
- Math proficiency
- 37% ▼ -16.00%
- Reading proficiency
- 56% ▼ -11.00%
- Median HH income
- $67,689
- Composite
- 41.5/100
- National rank
- #3456
- State rank
- #206 of 539 in PA
Livability — Manheim
- Score
- 79/100
- State rank
- #236
- US rank
- #2155
Category grades
Schools grade is shown separately in the Schools card above.
Census & demographics
- City population
- 23,556
- Population (ZIP)
- 3,229
Population outlook (York County) Hauer SSP2
- Today (2025)
- 454,205 people
- By 2030
- 457,407 · +0.7%
- By 2040
- 457,529 · +0.7%
- By 2050
- 448,261 · -1.3%
- By 2075
- 427,388 · -5.9%
- By 2100
- 384,218 · -15.4%
Race, ethnicity, and origin ACS 2023
- Neighborhood character
- Predominantly White (90%)
- Race & ethnicity
- White 90% Hispanic / Latino 6% Two or more races 4%
- Hispanic origin (detail)
- Mexican 6%
- Common ancestry
- Iranian 2% Serbian 2% Slovak 1%
- Foreign-born
- 0%
Political lean MEDSL · York
- 2024 margin
- Strong R (+25.3) · D 36.9% · R 62.1%
- 2008→2024 swing
- -11.7pp toward R · 2008: -13.6pp · 2024: -25.3pp
- All cycles
- 2024: R+25.3 2020: R+24.6 2016: R+29.3 2012: R+21.2 2008: R+13.6
Not yet ingested
- Civics
- —
Market trends
- HPI YoY
- ▲ 20.72%
- Current HPI
- 286.965
- Rent YoY
- —
- Metro
- —
- State GDP YoY
- ▲ 1.68%
- F500 in state
- 34
Industry mix (Fortune 500 HQ in PA)
| Industry | F500 HQs | Revenue |
|---|---|---|
| Healthcare | 2 | $309B |
|
||
| Insurance | 2 | $27B |
|
||
| Telecommunications / Media | 1 | $124B |
|
||
| Industrial Distribution | 1 | $22B |
|
||
| Financial Services | 1 | $20B |
|
||
| Chemicals / Materials | 1 | $18B |
|
||
Price history
1 event — show timeline
- 2026-06-12 Coming Soon $315,000 BRIGHT MLS
Property tax history
+2.8%/yrLatest (2026): $4,298 · +5.6% YoY. Source: county tax records.
Cash-flow waterfall
monthlySold comps — $/sqft
last 12 mo · ≤1 miLoading sold comps…