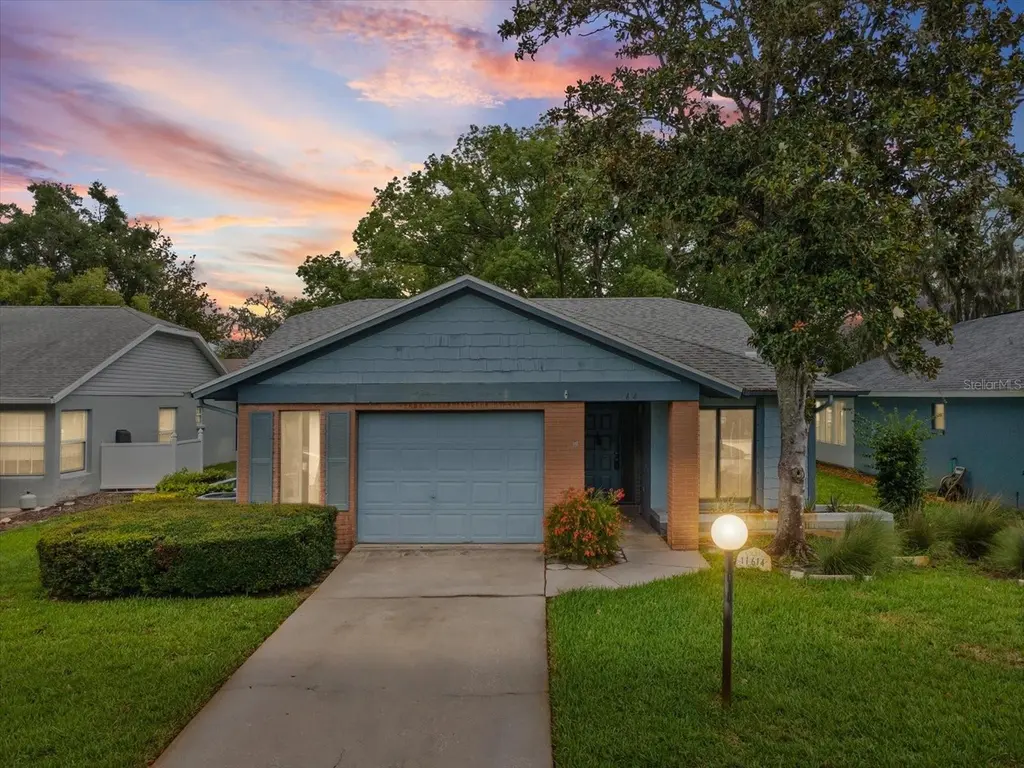
11614 Rose Tree Dr
Moon Lake, FL 34654
$200,000D+
2 bd · 2.0 ba ·
1,280 sqft ·
Built 1985
· SingleFamily
· Pending
· 12 DOM
Cashflow @ list (25.0% down · 7.5%)
Estimated rent
$1,947/mo
Mortgage (P&I)
−$1,049
Tax + insurance
−$141
HOA
−$322
Vac / Maint / Mgmt
−$409
Net cashflow
$27/mo
Annual
$326/yr
Cap rate
6.46%
Cash-on-cash
0.58%
DSCR
1.03
1% rule
0.97%
Cash to close
$56,000
Investor read
- This is a 2-bed/2.0-bath single-family listed at $200k.
- At list price, monthly cash flow is $27 ($326/yr) — positive.
- The deal already cash-flows at list — no discount required.
- To meet the 1% rule (rent ≥ 1% of price), the offer needs to be $195k (2.6% below list).
- Only 12 days on market — expect competitive offers; lowballing is unlikely to land.
- Recommended offer: $195k (2.6% below list) — sets the bar for 1% rule.
- Local home prices are declining (-3.0%/yr); year-one equity from $1k of loan paydown is wiped out by about $6k of value loss. Plan a longer hold.
- Location reads 56/100 on livability (#871 in FL) — a working-class tenant base; expect higher turnover. Strengths: cost of living A+, housing A+; Watch: schools F, amenities F, commute F.
- Pasco (suburban): math 50% / reading 52% proficiency, ranked #32 of 73 in FL (top 44%) — acceptable for families but not a draw, mixed tenant base, ~2y average lease.
- Market conditions: Rents soft (-1.9%/yr); 353 active listings in the ZIP; 11 comparable units currently listed for rent nearby; rentals at typical pace (median 18d on market — plan ~3-4 weeks tenant-placement turnaround); 6,765 units permitted in Pasco County in 2024 (1,250 in 5+ unit buildings).
- Pasco County population projected at +29% by 2050 — long-run rental-demand tailwind backs the buy-and-hold thesis.
- 2 sale attempts with the ask held roughly flat each time — persistent listings suggest the price (not the market) is what's stuck; bring a comps-based counter.
- Current owner paid $64k; list at $200k implies a 215% gain — meaningful room to come down on a strong offer.
- Climate carrying-cost: severe wind risk, 99% chance of damaging wind over 30y; extreme-heat days projected 7→27/yr by 2055 (HVAC capex compounding) — expect insurance premiums to compound above CPI over the hold.
- Cap rate 6.5% vs local median 4.4% in Moon Lake — top-decile yield for the area; either an underpriced asset or a hidden risk that comps aren't pricing in. Stress-test before assuming the spread holds.
- This rent runs 32% of the median local income ($74k/yr) — at the standard rent-burdened threshold; future hikes will face affordability resistance.
Questions for listing agent
- What does the HOA fee cover, when was the last increase, and are there any pending special assessments or reserve-fund shortfalls?
- Is there a deadline driving the sale (1031 exchange, divorce, estate, relocation)? That informs how much negotiation room exists.
- Schools are F-rated, which usually means shorter tenancies and higher turnover. Who's the typical renter profile here, and what's been the actual vacancy rate?
- The area grade is low — what's the realistic commute time and amenity access for the typical tenant pool here? Any planned neighborhood developments (good or bad) we should know about?
- What's the average days-on-market for RENTAL listings here right now (not sales)? A rising rental-DOM trend means longer vacancies and softer asking-rent achievability than the comps imply.
- What's the recent tenant-quality profile in this submarket — average credit score on applications, eviction rate, late-payment / NSF rate, and stable-employment percentage? A property-management company in the area should have these aggregated.
- How much new for-sale + rental construction is in the pipeline within 1–3 miles? Heavy new supply typically softens prices + rents 12–24 months out; constrained supply supports both.
CashFlowRE · CFR-PGXJDGCN01Z2RJ
· Data 5 days ago
cashflowre.app · 2026-05-29