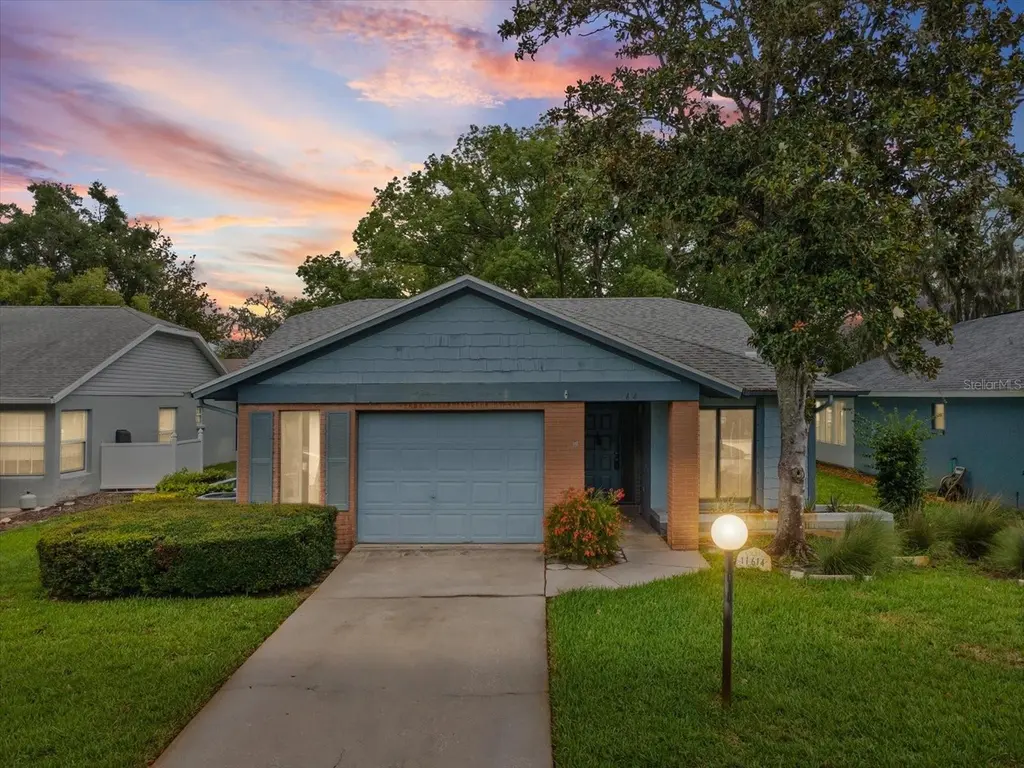
11614 Rose Tree Dr · Moon Lake, FL
Flood risk 1/10 · Minimal
- FEMA flood zone
- X (unshaded)
- Chance of flooding over 30 yrs
- 0.0%
- Est. flood insurance / yr
- $507 – $1,088
Fire risk 3/10 · Minor
- Est. fire insurance / yr
- $947 – $1,759
Heat risk 10/10 · Severe
- Hot days now (above 108°F)
- 7 days/yr
- Hot days in 30 yrs
- 27 days/yr
Wind risk 10/10 · Severe
- Chance of severe wind over 30 yrs
- 99.0%
Air-quality risk 2/10 · Minimal
- Unhealthy air days now
- 1 days/yr
- Unhealthy air days in 30 yrs
- 3 days/yr
Risk factors via First Street. Map © Google.
Why this score? — see what drove the D+ grade
The composite is a weighted blend of 9 inputs, each scored 0–100. Each bar is that input's sub-score; the figure is the points it added to the 100-point composite (weight × sub-score).
- ARV discount +14.7/15.0
- Cash flow +14.0/30.0
- 1% rule +4.7/10.0
- DSCR +4.3/10.0
- Schools +4.3/10.0
- Livability +2.8/5.0
- Condition / age +2.5/5.0
- Rent growth +2.0/5.0
- Appreciation +0.0/10.0
$200,000
🖨 Deal sheet 📄 Offer letter ✓ Due diligence
Listing remarks
Under contract-accepting backup offers. OPPORTUNITY AWAITS IN DESIRABLE SUMMERTREE! THIS TRUE 3-BEDROOM, 2-BATH HOME IS LOCATED IN THE WELL -ESTABLISHED COMMUNITY OF ARBORWOOD IN SUMMERTREE KNOWN FOR ITS PEACEFUL SETTING, MATURE LANDSCAPING, WILDLIFE, AND OUTSTANDING AMENITIES AT A VERY AFFORDABLE PRICE! ARBORWOOD HAS ITS OWN POOL ALONG WITH THE COMMUNITY POOL FOR NEIGHBORLY GET TOGETHERS! WITH A FUNCTIONAL LAYOUT, SOLID BONES, AND MAJOR UPDATES ALREADY COMPLETED, 2021 ROOF, 2019 HOT WATER HEATER ALLOWS YOU TO FOCUS ON COSMETIC UPDATES AND PERSONAL TOUCHES TO MAKE THIS HOME TRULY YOUR OWN! THIS PROPERTY PRESENTS TREMENDOUS POTENTIAL AS EITHER AN INVESTMENT OPPORTUNITY OR YOUR FOREVER HOME
Key facts
- Community pool
- Functional layout
- Major updates
Tags
Property features AI
Finance
- Other: Homestead exemption claimed; Senior community; Pets allowed (cats and dogs OK); Association approval required for buyers
- Financial info: Lease restrictions apply
- HOA & community: Has HOA; buyer approval required; Monthly HOA approximately $250; Quarterly association fees (examples listed: $750 and $218); Association amenities include pool, clubhouse, fitness center, tennis courts, recreational facilities, maintenance of grounds, escrow reserves; Community features also include golf, golf cart access, sidewalks, deed restrictions, pool, clubhouse
Exterior
- Parking: Attached garage; Oversized garage with garage door opener; 1 garage space
- Security: Gated community
- Utilities: Public water; Public sewer; Electricity connected; Water connected; Sewer connected
- Home design: Single family residence; One story; Faces southwest; Accessible doors and accessible full bath
- Construction: Block and stucco construction; Shingle roof; Slab foundation; Built as a residential property
- Exterior features: Enclosed patio/porch; French doors; Sidewalks; Asphalt/paved road access; Lot approximately 0.15 acres
Interior
- Kitchen: Refrigerator
- Bedrooms: 3 bedrooms
- Flooring: Laminate; Tile
- Bathrooms: 2 full bathrooms
- Heating & cooling: Central heating (electric); Central air conditioning
- Interior features: High ceilings; Open floorplan; Florida room
- Laundry & utility: Washer; Dryer; Laundry area in garage; Irrigation equipment
Neighborhood map
What this means for you Summary
Snapshot
- This is a 2-bed/2.0-bath single-family listed at $200k.
Deal economics
- At list price, monthly cash flow is $27 ($326/yr) — positive.
- The deal already cash-flows at list — no discount required.
- To meet the 1% rule (rent ≥ 1% of price), the offer needs to be $195k (2.6% below list).
- Recommended offer: $195k (2.6% below list) — sets the bar for 1% rule.
- Cap rate 6.5% vs local median 4.4% in Moon Lake — top-decile yield for the area; either an underpriced asset or a hidden risk that comps aren't pricing in. Stress-test before assuming the spread holds.
Location & tenants
- Location reads 56/100 on livability (#871 in FL) — a working-class tenant base; expect higher turnover. Strengths: cost of living A+, housing A+; Watch: schools F, amenities F, commute F.
- Pasco (suburban): math 50% / reading 52% proficiency, ranked #32 of 73 in FL (top 44%) — acceptable for families but not a draw, mixed tenant base, ~2y average lease.
- Market conditions: Rents soft (-1.9%/yr); 353 active listings in the ZIP; 11 comparable units currently listed for rent nearby; rentals at typical pace (median 18d on market — plan ~3-4 weeks tenant-placement turnaround); 6,765 units permitted in Pasco County in 2024 (1,250 in 5+ unit buildings).
- This rent runs 32% of the median local income ($74k/yr) — at the standard rent-burdened threshold; future hikes will face affordability resistance.
Forward outlook
- Local home prices are declining (-3.0%/yr); year-one equity from $1k of loan paydown is wiped out by about $6k of value loss. Plan a longer hold.
- Pasco County population projected at +29% by 2050 — long-run rental-demand tailwind backs the buy-and-hold thesis.
Negotiation context
- Only 12 days on market — expect competitive offers; lowballing is unlikely to land.
- 2 sale attempts with the ask held roughly flat each time — persistent listings suggest the price (not the market) is what's stuck; bring a comps-based counter.
- Current owner paid $64k; list at $200k implies a 215% gain — meaningful room to come down on a strong offer.
Risks & watch-outs
- Climate carrying-cost: severe wind risk, 99% chance of damaging wind over 30y; extreme-heat days projected 7→27/yr by 2055 (HVAC capex compounding) — expect insurance premiums to compound above CPI over the hold.
Questions for the listing agent
- What does the HOA fee cover, when was the last increase, and are there any pending special assessments or reserve-fund shortfalls?
- Is there a deadline driving the sale (1031 exchange, divorce, estate, relocation)? That informs how much negotiation room exists.
- Schools are F-rated, which usually means shorter tenancies and higher turnover. Who's the typical renter profile here, and what's been the actual vacancy rate?
- The area grade is low — what's the realistic commute time and amenity access for the typical tenant pool here? Any planned neighborhood developments (good or bad) we should know about?
- What's the average days-on-market for RENTAL listings here right now (not sales)? A rising rental-DOM trend means longer vacancies and softer asking-rent achievability than the comps imply.
- What's the recent tenant-quality profile in this submarket — average credit score on applications, eviction rate, late-payment / NSF rate, and stable-employment percentage? A property-management company in the area should have these aggregated.
- How much new for-sale + rental construction is in the pipeline within 1–3 miles? Heavy new supply typically softens prices + rents 12–24 months out; constrained supply supports both.
Investment metrics
- 1% rule
- 0.97% ✗
- Cap rate
- 6.46%
- Cash-on-cash
- 0.58%
- DSCR
- 1.03
- GRM
- 8.6
CMA / ARV
- ARV (on-the-fly)
- $238,080
- Comps found
- 12
Show comp detail 12 sales within ~0.75 mi
| Address | Dist | Beds/Ba | Sqft | Sold | Price | $/sf | Match |
|---|---|---|---|---|---|---|---|
| 11719 Alderwood Dr | 0.14mi | 2/2.0 | 1,287 (+0%) | 3mo | $239,000 | $186 | 90 |
| 11717 Aspenwood Dr | 0.25mi | 2/2.0 | 1,255 (-2%) | 5mo | $200,000 | $159 | 81 |
| 11621 Pear Tree Dr | 0.03mi | 2/2.0 | 1,414 (+10%) | 9mo | $250,000 | $177 | 74 |
| 11704 Aspenwood Dr | 0.29mi | 3/2.0 (+1) | 1,342 (+5%) | 1mo | $229,500 | $171 | 72 |
| 11645 Holly Ann Dr | 0.45mi | 2/2.0 | 1,376 (+8%) | 7mo | $315,000 | $229 | 61 |
| 11728 Aspenwood Dr | 0.28mi | 2/2.0 | 1,466 (+14%) | 6mo | $250,000 | $171 | 58 |
| 11512 Yellow Birch Ct | 0.08mi | 3/2.5 (+1) | 1,471 (+15%) | 10mo | $225,000 | $153 | 57 |
| 11723 Foxworth Ln | 0.37mi | 2/2.0 | 1,096 (-14%) | 3mo | $240,000 | $219 | 56 |
| 11338 Golf Round Dr | 0.53mi | 2/2.0 | 1,426 (+11%) | 1mo | $270,000 | $189 | 55 |
| 11100 Bounty St | 0.72mi | 3/2.0 (+1) | 1,366 (+7%) | 6mo | $252,000 | $184 | 45 |
| 11829 Kestrel Dr | 0.69mi | 3/2.0 (+1) | 1,394 (+9%) | 4mo | $300,000 | $215 | 44 |
| 11040 Blackwood Dr | 0.62mi | 3/2.5 (+1) | 1,448 (+13%) | 7mo | $364,500 | $252 | 36 |
Match score weights: distance 35% · size 25% · config 20% · recency 20%. Top-matched comps best support the ARV.
Projected returns pro-forma
-3.0% appreciation · 0.0% rent growth · sell at horizon
- IRR
- -19.1%
- Equity multiple
- 0.35×
- Total profit
- $-36,278
- Equity at exit
- $29,821
- IRR
- -20.4%
- Equity multiple
- 0.09×
- Total profit
- $-50,977
- Equity at exit
- $17,292
Cash invested: $56,000 (down + closing). Projections, not guarantees.
Landlord ↔ Tenant lean methodology
- Overall (STATE)
- 87 Strongly Landlord-Friendly
- State Florida
- 87 Strongly Landlord-Friendly · R+3
- County
- — inherits STATE
- City
- — inherits STATE
ZIP-level market 34654
- Home prices YoY
- -12.7%
- Rents YoY
- -1.9%
- Active inventory
- 353
- Price-to-rent
- 8.6×
Monthly cashflow live
- Estimated rent
- $1,947 high interval (Pro) →
- Mortgage (P&I)
- −$1,049
- Tax from tax record
- −$57 /mo · $686/yr
- Insurance
- −$83
- HOA
- −$322
- Vacancy / Maint / Mgmt
- −$409
- Net cashflow
- $27
Break-even live
UW: 25.0% down · 7.5% · 30yr · 1.5% tax · 5.0% vac · 8.0% maint · 8.0% mgmt
Financing live
Cash to close
- Down payment
- $50,000
- Closing costs
- $6,000
- Reserves months
- —
- Total cash needed
- —
Loan-product check · same deal, 3 products live
Conventional
25% down · 7.5% · 30yr
- Down + closing
- —
- Monthly P&I
- —
- Monthly cashflow
- —
- DSCR
- —
- Eligible?
- —
Personal DTI + credit; lowest rate.
DSCR
20% down · 8.5% · 30yr
- Down + closing
- —
- Monthly P&I
- —
- Monthly cashflow
- —
- DSCR
- —
- Eligible?
- —
No personal income docs; deal must DSCR.
Hard money
10% down · 12.0% · 12mo
- Down + closing
- —
- Monthly P&I
- —
- Monthly cashflow
- —
- DSCR
- —
- Eligible?
- —
Short-term bridge; refi at stabilization.
Rent comps 11 comps
| Address | Beds | Baths | Sqft | Rent | $/sqft | DOM | Units | Dist |
|---|---|---|---|---|---|---|---|---|
| 11630 Bayonet Ln New Port Richey, FL | 1.0 | 1.5 | 923 | $1,150 | $1.25 | 20d | 1 | 0.32mi |
| 12065 Grizzly Ln New Port Richey, FL | 3.0 | 2.5 | 1440 | $2,200 | $1.53 | 18d | 1 | 0.38mi |
| 11920 Palm Bay Ct New Port Richey, FL | 3.0 | 2.0 | 1770 | $2,100 | $1.19 | 12d | 1 | 0.38mi |
| 11920 Palm Bay Ct New Port Richey, FL | 3.0 | 2.0 | 1770 | $2,100 | $1.19 | 18d | 1 | 0.38mi |
| 12245 Grizzly Ln New Port Richey, FL | 3.0 | 2.5 | 1207 | $2,280 | $1.89 | 24d | 1 | 0.39mi |
| 12250 Grizzly Ln New Port Richey, FL | 3.0 | 2.5 | 1632 | $2,200 | $1.35 | 24d | 1 | 0.42mi |
| 12316 Grizzly Ln New Port Richey, FL | 3.0 | 2.5 | 1632 | $2,150 | $1.32 | 3d | 1 | 0.46mi |
| 11550 Baywood Meadows Dr #7 New Port Richey, FL | 2.0 | 1.0 | 1008 | $1,495 | $1.48 | 24d | 1 | 0.57mi |
| 12135 Environmental Dr #4 New Port Richey, FL | 3.0 | 2.0 | 1239 | $1,800 | $1.45 | 24d | 1 | 0.60mi |
| 12405 Shearwater Dr Unit 12405 New Port Richey, FL | 2.0 | 2.0 | 1000 | $1,600 | $1.60 | 3d | 1 | 0.86mi |
| 12036 Tasha Ct New Port Richey, FL | 3.0 | 2.0 | 1732 | $2,155 | $1.24 | 3d | 1 | 0.94mi |
HOA detail
- Monthly dues
- $322 · $3,864/yr
- Likely covers
- waterlandscapingpool
Listing history 8 events
-
2026-06-15statusdays on market $200,000 Pending 12 DOM
-
2026-06-13days on market $200,000 Active 11 DOM
-
2026-06-09days on market $200,000 Active 7 DOM
-
2026-06-08days on market $200,000 Active 6 DOM
-
2026-06-07days on market $200,000 Active 5 DOM
-
2026-06-04days on market $200,000 Active 2 DOM
-
2026-06-03remarks 699-char remark
-
2026-06-03$200,000 Active 1 DOM
ⓘ Source: listings_history table (triggers on properties + properties_extension) + one-shot
backfill from property_details.listing_events for pre-trigger history.
Tax reassessment forecast FL · Resets to sale price
- Current annual tax
- $686 · $57/mo
- Projected year-2 tax
- $1,660 · $138/mo
- Expected delta
- +$974/yr (+$81/mo · 141.9%)
ⓘ Screening estimate from a state-policy table — verify with the county assessor before closing.
Climate risk First Street
- Flood 1/10 Low FEMA zone X (unshaded) · 0% chance over 30 yrs
- Wildfire 3/10 Moderate
- Heat 10/10 Extreme 7 d/yr ≥108°F today · 27 d/yr by 30 yrs out
- Wind 10/10 Extreme 99% chance of damaging wind over 30 yrs
- Air quality 2/10 Low 1 unhealthy d/yr today · 3 by 30 yrs out
Nearby sold comps map
Loading sold comps map…
Walkable amenities ~0.75 mi
Loading nearby amenities…
Taxation est. · year 1
- Rental income
- $23,370
- − Mortgage interest
- −$11,203
- − Property taxes
- −$686
- − Insurance
- −$1,000
- − Repairs & maintenance
- −$1,870
- − Management
- −$1,870
- − HOA
- −$3,864
- − Depreciation
- −$5,818
- Taxable loss
- −$2,941
- Est. tax savings @ 24.0%
- +$706
- After-tax cash flow
- $1,032/yr
For passive investors: Depreciation is non-cash, so a rental often shows a tax loss while cash-flowing — sheltering income. Rental losses are passive: they offset passive income freely, and up to $25,000/yr can offset ordinary (W-2) income if you actively participate and your MAGI is under $100k (phasing out to $0 by $150k); unused losses carry forward. On sale, claimed depreciation is recaptured at up to 25%, and gains may owe capital-gains tax (a 1031 exchange can defer both). Figures are a year-1 estimate at your 24.0% rate — not tax advice; consult a CPA.
Schools (NCES district)
- District
- Pasco
- NCES district ID
- 1201530
- Math proficiency
- 50% ▼ -10.00%
- Reading proficiency
- 52% ▼ -5.00%
- Median HH income
- $45,039
- Composite
- 43.14/100
- National rank
- #3074
- State rank
- #32 of 73 in FL
Livability — Moon Lake
- Score
- 56/100
- State rank
- #871
- US rank
- #22850
Category grades
Schools grade is shown separately in the Schools card above.
Census & demographics
- County
- Pasco County · 524,098 people
- Metro
- Tampa-St. Petersburg-Clearwater, FL
- Population (ZIP)
- 24,355
- Household income
- $73,947
- Rent vs Own
- Severe rent burden
- 179.0
Population outlook (Pasco County) Hauer SSP2
- Today (2025)
- 570,045 people
- By 2030
- 605,844 · +6.3%
- By 2040
- 674,806 · +18.4%
- By 2050
- 736,022 · +29.1%
- By 2075
- 862,900 · +51.4%
- By 2100
- 906,364 · +59.0%
Race, ethnicity, and origin ACS 2023
- Neighborhood character
- Predominantly White (81%)
- Race & ethnicity
- White 81% Hispanic / Latino 10% Two or more races 7% Black 3% Asian 2%
- Hispanic origin (detail)
- Puerto Rican 6%
- Common ancestry
- Romanian 4% Slovak 2% Italian 2%
- Foreign-born
- 7% · Canada, China, Jamaica
- Languages at home
- 88% English-only · Spanish 5% Russian/Polish/Slavic 2% Other Indo-European 1%
Political lean MEDSL · Pasco
- 2024 margin
- Strong R (+25.2) · D 36.9% · R 62.1% · Other 1.0%
- 2008→2024 swing
- -21.6pp toward R · 2008: -3.6pp · 2024: -25.2pp
- All cycles
- 2024: R+25.2 2020: R+20.1 2016: R+21.6 2012: R+6.7 2008: R+3.6
Not yet ingested
- Civics
- —
Market trends
- HPI YoY
- ▼ -42.63%
- Current HPI
- 294.4358
- Rent YoY
- ▼ -1.85%
- Metro
- Tampa-St. Petersburg-Clearwater, FL
- State GDP YoY
- ▲ 3.28%
- F500 in state
- 36
Industry mix (Fortune 500 HQ in FL)
| Industry | F500 HQs | Revenue |
|---|---|---|
| Industrial Technology | 2 | $29B |
|
||
| Insurance | 2 | $17B |
|
||
| Retail | 1 | $60B |
|
||
| Technology Distribution | 1 | $58B |
|
||
| Homebuilding | 1 | $35B |
|
||
| Technology Manufacturing | 1 | $35B |
|
||
Price history
+215.0% since first listed4 events — show timeline
- 2026-06-02 Listed $200,000 Stellar MLS as Distributed by MLS Grid
- 2026-04-05 Listing Removed — Stellar MLS as Distributed by MLS Grid
- 2026-03-12 Listed $189,900 Stellar MLS as Distributed by MLS Grid
- 1997-05-08 Sold (Public Records) $63,500 Public Records
Property tax history
+1.0%/yrLatest (2025): $686 · +2.4% YoY. Source: county tax records.
Cash-flow waterfall
monthlySold comps — $/sqft
last 12 mo · ≤1 miLoading sold comps…