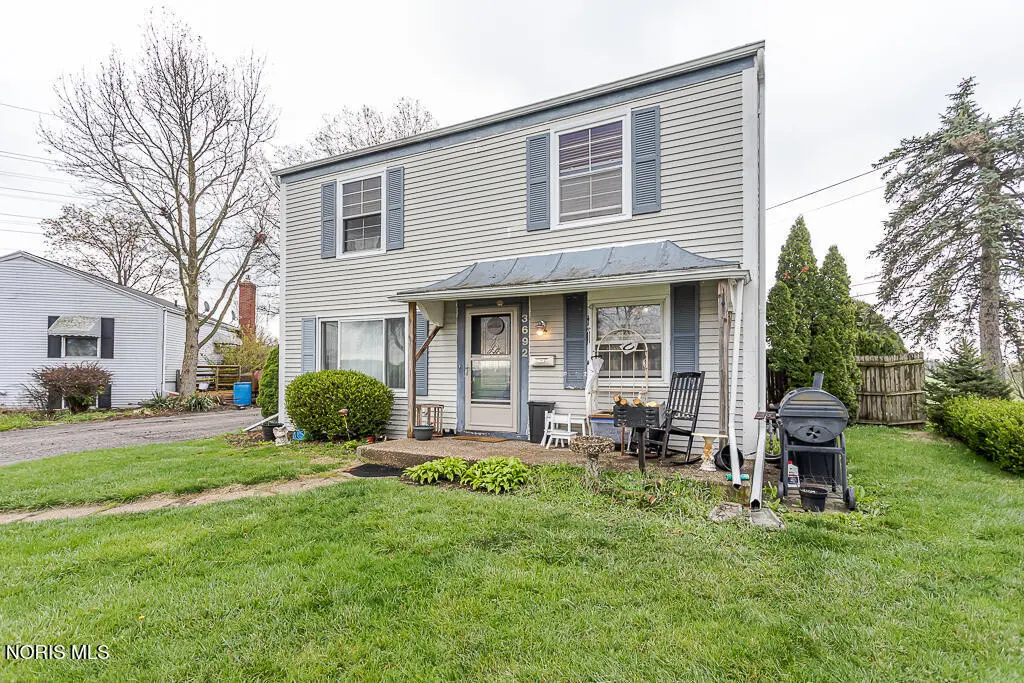
3692 Lakepointe Dr
Northwood, OH 43619
$82,450B-
2 bd · 1.5 ba ·
896 sqft ·
Built 1975
· Condo
· Active
· 52 DOM
Cashflow @ list (25.0% down · 7.5%)
Estimated rent
$1,091/mo
Mortgage (P&I)
−$432
Tax + insurance
−$122
HOA
−$0
Vac / Maint / Mgmt
−$229
Net cashflow
$307/mo
Annual
$3,683/yr
Cap rate
10.76%
Cash-on-cash
15.95%
DSCR
1.71
1% rule
1.32%
Cash to close
$23,086
Investor read
- This is a 2-bed/1.5-bath condo listed at $82k.
- At list price, monthly cash flow is $307 ($4k/yr) — positive.
- The deal already cash-flows at list — no discount required.
- Meets the 1% rule at list price ($1k rent vs $82k).
- It's been on market 52 days — a 3% lower offer ($80k) is reasonable based on typical stale-listing flexibility.
- Recommended offer: $80k (3.0% below list) — sets the bar for market timing.
- Local home prices are declining (-3.0%/yr); year-one equity from $570 of loan paydown is wiped out by about $2k of value loss. Plan a longer hold.
- Location reads 79/100 on livability (#151 in OH, #2,295 nationally) — a middle-class / working-renter tenant base. Strengths: cost of living A+, housing A+, health & safety A+; Watch: amenities F, commute F.
- Lake Local (rural): math 56% / reading 65% proficiency, ranked #282 of 656 in OH (top 43%) — acceptable for families but not a draw, mixed tenant base, ~2y average lease.
- Zoned schools: Lake Elementary School (math 74% / reading 72%, grade A, #315 of 1,584 statewide, top 20%, 654 students, 35% FRL); Lake Middle School (math 46% / reading 63%, grade B-, #342 of 654 statewide, top 54%, 359 students, 0% FRL); Lake High School (math 52% / reading 59%, grade C, #296 of 781 statewide, top 39%, 568 students, 60% FRL).
- Market conditions: 31 active listings in the ZIP; 1 comparable units currently listed for rent nearby; solid renter incomes; 493 units permitted in Wood County in 2024 (48 in 5+ unit buildings).
- Wood County population projected at +14% by 2050 — modest demand growth; plan on rents tracking national, not racing it.
- 2 sale attempts since 26y ago with the ask held roughly flat each time — persistent listings suggest the price (not the market) is what's stuck; bring a comps-based counter.
- Current owner paid $25k; list at $82k implies a 230% gain — meaningful room to come down on a strong offer.
- At projected returns (-3.0% appreciation + 3.0% rent growth), your $23k cash investment doubles in ~8 years — after that, you're playing with house money.
- Cap rate 10.8% vs local median 2.1% in Northwood — top-decile yield for the area; either an underpriced asset or a hidden risk that comps aren't pricing in. Stress-test before assuming the spread holds.
- This rent is only 17% of the median local income ($76k/yr) — well below the 30% rent-burden line; pricing power to push rent on renewal without tenant pushback.
Questions for listing agent
- It's been on market 52 days. Have you received any prior offers? Is the seller open to a 3% concession, seller financing, or rate buy-down credit?
- Built in 1975 — when were the roof, HVAC, electrical panel, plumbing, and water heater last replaced?
- Any open or pending special assessments — roof, HVAC, plumbing, elevator, façade? What's the per-unit balance and payoff schedule, and is the seller paying it off at close or rolling it to the buyer?
- Is there a deadline driving the sale (1031 exchange, divorce, estate, relocation)? That informs how much negotiation room exists.
- What's the average days-on-market for RENTAL listings here right now (not sales)? A rising rental-DOM trend means longer vacancies and softer asking-rent achievability than the comps imply.
- What's the recent tenant-quality profile in this submarket — average credit score on applications, eviction rate, late-payment / NSF rate, and stable-employment percentage? A property-management company in the area should have these aggregated.
- How much new apartment / multifamily construction is in the pipeline within 1–3 miles? Heavy new supply (>2% of stock underway) typically softens rents 12–24 months out; light construction supports rent growth.
CashFlowRE · CFR-PJRSDKCKMPNSMT
· Data 2 days ago
cashflowre.app · 2026-05-29