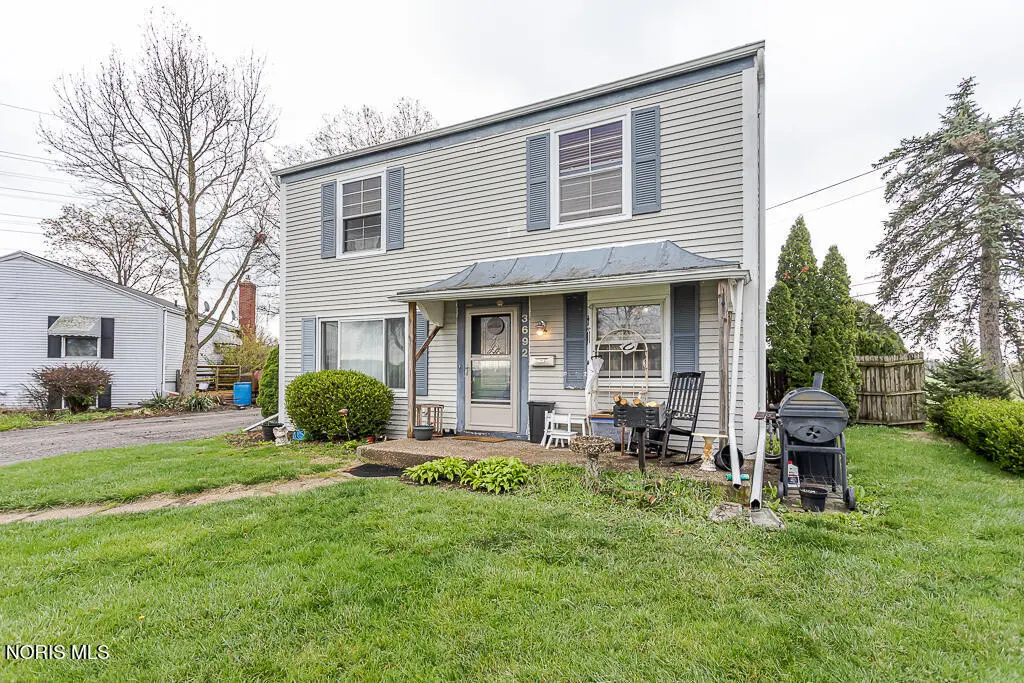
3692 Lakepointe Dr · Northwood, OH
Flood risk 1/10 · Minimal
- FEMA flood zone
- X (unshaded)
- Chance of flooding over 30 yrs
- 0.0%
- Est. flood insurance / yr
- $507 – $1,088
Fire risk 1/10 · Minimal
- Est. fire insurance / yr
- $713 – $1,323
Heat risk 3/10 · Minor
- Hot days now (above 99°F)
- 7 days/yr
- Hot days in 30 yrs
- 16 days/yr
Wind risk 2/10 · Minimal
- Chance of severe wind over 30 yrs
- —
Air-quality risk 2/10 · Minimal
- Unhealthy air days now
- 1 days/yr
- Unhealthy air days in 30 yrs
- 2 days/yr
Risk factors via First Street. Map © Google.
Why this score? — see what drove the B- grade
The composite is a weighted blend of 9 inputs, each scored 0–100. Each bar is that input's sub-score; the figure is the points it added to the 100-point composite (weight × sub-score).
- Cash flow +30.0/30.0
- DSCR +10.0/10.0
- 1% rule +8.2/10.0
- ARV discount +7.5/15.0
- Schools +5.2/10.0
- Livability +4.0/5.0
- Rent growth +2.5/5.0
- Condition / age +2.5/5.0
- Appreciation +0.0/10.0
$82,450
🖨 Deal sheet 📄 Offer letter ✓ Due diligence
Listing remarks MLS
NATURAL WOOD PARQUET FLOORING THROUGHOUT ENTRY AND EAT-IN KITCHEN. MINT CONDITION. MOVE IN AT CLOSING. HALF BATH ON MAIN LEVEL. ALL APPLIANCES STAY. NEWER ROOF, DISHWASHER, WASHER/DRYER, FRONT DOOR AND DISPOSAL.
Key facts
- Garage
- Built 1975
- Listed 52 days
Property features AI
Exterior
- Parking: 1-car garage; Asphalt driveway
- Utilities: Electricity connected; Natural gas connected; Public water; Public sewer; WiFi available
- Home design: Residential condominium (detached, no common walls); Two-story house; 2 total stories
- Construction: Shingle siding; Crawl space foundation; Built with house-style construction
- Exterior features: Rear porch; Shingle roof
Interior
- Kitchen: Dishwasher; Gas oven; Refrigerator; Eat-in layout
- Bedrooms: Upper-level bedrooms (two 10' x 10'); Main-level living room (10' x 10')
- Flooring: Carpet; Ceramic tile
- Bathrooms: 1 full bathroom; 1 half bathroom (1.5 total)
- Heating & cooling: Forced air heating; Central air conditioning
- Interior features: Eat-in kitchen; 4 total rooms
- Laundry & utility: In-unit laundry
Neighborhood map
What this means for you Summary
Snapshot
- This is a 2-bed/1.5-bath condo listed at $82k.
Deal economics
- At list price, monthly cash flow is $307 ($4k/yr) — positive.
- The deal already cash-flows at list — no discount required.
- Meets the 1% rule at list price ($1k rent vs $82k).
- Recommended offer: $80k (3.0% below list) — sets the bar for market timing.
- Cap rate 10.8% vs local median 2.1% in Northwood — top-decile yield for the area; either an underpriced asset or a hidden risk that comps aren't pricing in. Stress-test before assuming the spread holds.
Location & tenants
- Location reads 79/100 on livability (#151 in OH, #2,295 nationally) — a middle-class / working-renter tenant base. Strengths: cost of living A+, housing A+, health & safety A+; Watch: amenities F, commute F.
- Lake Local (rural): math 56% / reading 65% proficiency, ranked #282 of 656 in OH (top 43%) — acceptable for families but not a draw, mixed tenant base, ~2y average lease.
- Zoned schools: Lake Elementary School (math 74% / reading 72%, grade A, #315 of 1,584 statewide, top 20%, 654 students, 35% FRL); Lake Middle School (math 46% / reading 63%, grade B-, #342 of 654 statewide, top 54%, 359 students, 0% FRL); Lake High School (math 52% / reading 59%, grade C, #296 of 781 statewide, top 39%, 568 students, 60% FRL).
- Market conditions: 31 active listings in the ZIP; 1 comparable units currently listed for rent nearby; solid renter incomes; 493 units permitted in Wood County in 2024 (48 in 5+ unit buildings).
- This rent is only 17% of the median local income ($76k/yr) — well below the 30% rent-burden line; pricing power to push rent on renewal without tenant pushback.
Forward outlook
- Local home prices are declining (-3.0%/yr); year-one equity from $570 of loan paydown is wiped out by about $2k of value loss. Plan a longer hold.
- Wood County population projected at +14% by 2050 — modest demand growth; plan on rents tracking national, not racing it.
- At projected returns (-3.0% appreciation + 3.0% rent growth), your $23k cash investment doubles in ~8 years — after that, you're playing with house money.
Negotiation context
- It's been on market 52 days — a 3% lower offer ($80k) is reasonable based on typical stale-listing flexibility.
- 2 sale attempts since 26y ago with the ask held roughly flat each time — persistent listings suggest the price (not the market) is what's stuck; bring a comps-based counter.
- Current owner paid $25k; list at $82k implies a 230% gain — meaningful room to come down on a strong offer.
Questions for the listing agent
- It's been on market 52 days. Have you received any prior offers? Is the seller open to a 3% concession, seller financing, or rate buy-down credit?
- Built in 1975 — when were the roof, HVAC, electrical panel, plumbing, and water heater last replaced?
- Any open or pending special assessments — roof, HVAC, plumbing, elevator, façade? What's the per-unit balance and payoff schedule, and is the seller paying it off at close or rolling it to the buyer?
- Is there a deadline driving the sale (1031 exchange, divorce, estate, relocation)? That informs how much negotiation room exists.
- What's the average days-on-market for RENTAL listings here right now (not sales)? A rising rental-DOM trend means longer vacancies and softer asking-rent achievability than the comps imply.
- What's the recent tenant-quality profile in this submarket — average credit score on applications, eviction rate, late-payment / NSF rate, and stable-employment percentage? A property-management company in the area should have these aggregated.
- How much new apartment / multifamily construction is in the pipeline within 1–3 miles? Heavy new supply (>2% of stock underway) typically softens rents 12–24 months out; light construction supports rent growth.
Investment metrics
- 1% rule
- 1.32% ✓
- Cap rate
- 10.76%
- Cash-on-cash
- 15.95%
- DSCR
- 1.71
- GRM
- 6.3
CMA / ARV
No comps found within radius.
Projected returns pro-forma
-3.0% appreciation · 3.0% rent growth · sell at horizon
- IRR
- 6.9%
- Equity multiple
- 1.27×
- Total profit
- $6,194
- Equity at exit
- $12,294
- IRR
- 16.2%
- Equity multiple
- 2.33×
- Total profit
- $30,594
- Equity at exit
- $7,129
Cash invested: $23,086 (down + closing). Projections, not guarantees.
Landlord ↔ Tenant lean methodology
- Overall (STATE)
- 73 Landlord-Friendly
- State Ohio
- 73 Landlord-Friendly · R+6
- County
- — inherits STATE
- City
- — inherits STATE
ZIP-level market 43619
- Home prices YoY
- -29.2%
- Active inventory
- 31
- Price-to-rent
- 6.3×
Monthly cashflow live
- Estimated rent
- $1,091 medium interval (Pro) →
- Mortgage (P&I)
- −$432
- Tax from tax record
- −$88 /mo · $1,056/yr
- Insurance
- −$34
- HOA
- −$0
- Vacancy / Maint / Mgmt
- −$229
- Net cashflow
- $307
Break-even live
UW: 25.0% down · 7.5% · 30yr · 1.5% tax · 5.0% vac · 8.0% maint · 8.0% mgmt
Financing live
Cash to close
- Down payment
- $20,612
- Closing costs
- $2,474
- Reserves months
- —
- Total cash needed
- —
Loan-product check · same deal, 3 products live
Conventional
25% down · 7.5% · 30yr
- Down + closing
- —
- Monthly P&I
- —
- Monthly cashflow
- —
- DSCR
- —
- Eligible?
- —
Personal DTI + credit; lowest rate.
DSCR
20% down · 8.5% · 30yr
- Down + closing
- —
- Monthly P&I
- —
- Monthly cashflow
- —
- DSCR
- —
- Eligible?
- —
No personal income docs; deal must DSCR.
Hard money
10% down · 12.0% · 12mo
- Down + closing
- —
- Monthly P&I
- —
- Monthly cashflow
- —
- DSCR
- —
- Eligible?
- —
Short-term bridge; refi at stabilization.
Rent comps 1 comps
| Address | Beds | Baths | Sqft | Rent | $/sqft | DOM | Units | Dist |
|---|---|---|---|---|---|---|---|---|
| 3617 Lakepointe Dr Northwood, OH | 1.0–4.0 | 1.0–1.5 | 887 | $1,091 | $1.23 | 14d | 12 | 0.06mi |
HOA detail condo
- Monthly dues
- $0 · $0/yr
- Assessments
- None detected in remarks — confirm with the listing agent.
Listing history 24 events
-
2026-06-18days on market $82,450 Active 52 DOM
-
2026-06-17days on market $82,450 Active 51 DOM
-
2026-06-16days on market $82,450 Active 50 DOM
-
2026-06-15days on market $82,450 Active 49 DOM
-
2026-06-14days on market $82,450 Active 47 DOM
-
2026-06-10days on market $82,450 Active 44 DOM
-
2026-06-09pricedays on market $82,450 Active 43 DOM
-
2026-06-08days on market $84,900 Active 42 DOM
-
2026-06-07days on market $84,900 Active 41 DOM
-
2026-06-05days on market $84,900 Active 38 DOM
-
2026-06-03days on market $84,900 Active 37 DOM
-
2026-06-02days on market $84,900 Active 36 DOM
-
2026-06-01days on market $84,900 Active 35 DOM
-
2026-05-31days on market $84,900 Active 34 DOM
-
2026-05-30days on market $84,900 Active 33 DOM
-
2026-04-27$84,900 Active
-
2025-10-14price $50,000 211-char remark
Show marketing remark (211 chars)
NATURAL WOOD PARQUET FLOORING THROUGHOUT ENTRY AND EAT-IN KITCHEN. MINT CONDITION. MOVE IN AT CLOSING. HALF BATH ON MAIN LEVEL. ALL APPLIANCES STAY. NEWER ROOF, DISHWASHER, WASHER/DRYER, FRONT DOOR AND DISPOSAL.
-
2018-11-05soldstatus $25,000
-
2001-01-09soldstatus $50,000
-
2001-01-02soldstatus $50,000 211-char remark
Show marketing remark (211 chars)
NATURAL WOOD PARQUET FLOORING THROUGHOUT ENTRY AND EAT-IN KITCHEN. MINT CONDITION. MOVE IN AT CLOSING. HALF BATH ON MAIN LEVEL. ALL APPLIANCES STAY. NEWER ROOF, DISHWASHER, WASHER/DRYER, FRONT DOOR AND DISPOSAL.
-
2000-09-21$51,500 211-char remark
Show marketing remark (211 chars)
NATURAL WOOD PARQUET FLOORING THROUGHOUT ENTRY AND EAT-IN KITCHEN. MINT CONDITION. MOVE IN AT CLOSING. HALF BATH ON MAIN LEVEL. ALL APPLIANCES STAY. NEWER ROOF, DISHWASHER, WASHER/DRYER, FRONT DOOR AND DISPOSAL.
-
1995-09-20soldstatus $26,500
-
1991-08-30soldstatus $26,500
-
1990-11-06soldstatus $26,750
ⓘ Source: listings_history table (triggers on properties + properties_extension) + one-shot
backfill from property_details.listing_events for pre-trigger history.
Tax reassessment forecast OH · Partial reset (capped growth)
- Current annual tax
- $1,056 · $88/mo
- Projected year-2 tax
- $1,171 · $98/mo
- Expected delta
- +$115/yr (+$10/mo · 10.9%)
ⓘ Screening estimate from a state-policy table — verify with the county assessor before closing.
Climate risk First Street
- Flood 1/10 Low FEMA zone X (unshaded) · 0% chance over 30 yrs
- Wildfire 1/10 Low
- Heat 3/10 Moderate 7 d/yr ≥99°F today · 16 d/yr by 30 yrs out
- Wind 2/10 Low
- Air quality 2/10 Low 1 unhealthy d/yr today · 2 by 30 yrs out
Nearby sold comps map
Loading sold comps map…
Walkable amenities ~0.75 mi
Loading nearby amenities…
Taxation est. · year 1
- Rental income
- $13,088
- − Mortgage interest
- −$4,618
- − Property taxes
- −$1,056
- − Insurance
- −$412
- − Repairs & maintenance
- −$1,047
- − Management
- −$1,047
- − Depreciation
- −$2,399
- Taxable income
- $2,509
- Est. tax owed @ 24.0%
- −$602
- After-tax cash flow
- $3,081/yr
For passive investors: Depreciation is non-cash, so a rental often shows a tax loss while cash-flowing — sheltering income. Rental losses are passive: they offset passive income freely, and up to $25,000/yr can offset ordinary (W-2) income if you actively participate and your MAGI is under $100k (phasing out to $0 by $150k); unused losses carry forward. On sale, claimed depreciation is recaptured at up to 25%, and gains may owe capital-gains tax (a 1031 exchange can defer both). Figures are a year-1 estimate at your 24.0% rate — not tax advice; consult a CPA.
Schools (NCES district)
- District
- Lake Local
- NCES district ID
- 3905069
- Math proficiency
- 56% ▼ -6.00%
- Reading proficiency
- 65% ▼ -2.00%
- Median HH income
- $51,218
- Composite
- 51.58/100
- National rank
- #1710
- State rank
- #282 of 656 in OH
Livability — Northwood
- Score
- 79/100
- State rank
- #151
- US rank
- #2295
Category grades
Schools grade is shown separately in the Schools card above.
Census & demographics
- County
- Wood · 127,168 people
- City population
- 7,151
- Metro
- Toledo, OH
- Population (ZIP)
- 7,151
- Household income
- $75,883
- Rent vs Own
- Severe rent burden
- 21.5
Population outlook (Wood County) Hauer SSP2
- Today (2025)
- 138,744 people
- By 2030
- 143,189 · +3.2%
- By 2040
- 150,896 · +8.8%
- By 2050
- 158,589 · +14.3%
- By 2075
- 182,166 · +31.3%
- By 2100
- 196,533 · +41.7%
Race, ethnicity, and origin ACS 2023
- Neighborhood character
- Predominantly White (86%)
- Race & ethnicity
- White 86% Hispanic / Latino 7% Two or more races 6% Asian 1%
- Hispanic origin (detail)
- Mexican 6%
- Common ancestry
- Romanian 7% Lithuanian 2% Serbian 2%
- Foreign-born
- 2% · Canada
- Languages at home
- 96% English-only · Other Asian/Pacific 2% Other Indo-European 1%
Political lean MEDSL · Wood
- 2024 margin
- R (+10.2) · D 44.4% · R 54.6%
- 2008→2024 swing
- -17.3pp toward R · 2008: 7.1pp · 2024: -10.2pp
- All cycles
- 2024: R+10.2 2020: R+7.6 2016: R+8.5 2012: D+4.2 2008: D+7.1
Not yet ingested
- Civics
- —
Market trends
- HPI YoY
- ▼ -74.49%
- Current HPI
- 180.5853
- Rent YoY
- —
- Metro
- —
- State GDP YoY
- ▲ 1.98%
- F500 in state
- 48
Industry mix (Fortune 500 HQ in OH)
| Industry | F500 HQs | Revenue |
|---|---|---|
| Insurance | 3 | $145B |
|
||
| Industrial Machinery | 3 | $49B |
|
||
| Financial Services | 3 | $24B |
|
||
| Consumer Goods | 2 | $93B |
|
||
| Aerospace / Defense | 2 | $47B |
|
||
| Utilities | 2 | $33B |
|
||
Price history
+217.4% since first listed9 events — show timeline
- 2026-04-27 Listed $84,900 NORIS
- 2025-10-14 Price Changed $50,000 NORIS
- 2018-11-05 Sold (Public Records) $25,000 Public Records
- 2001-01-09 Sold (Public Records) $50,000 Public Records
- 2001-01-02 Sold (MLS) $50,000 NORIS
- 2000-09-21 Listed $51,500 NORIS
- 1995-09-20 Sold (Public Records) $26,500 Public Records
- 1991-08-30 Sold (Public Records) $26,500 Public Records
- 1990-11-06 Sold (Public Records) $26,750 Public Records
Property tax history
+0.2%/yrLatest (2025): $1,056 · +1.1% YoY. Source: county tax records.
Cash-flow waterfall
monthlySold comps — $/sqft
last 12 mo · ≤1 miLoading sold comps…