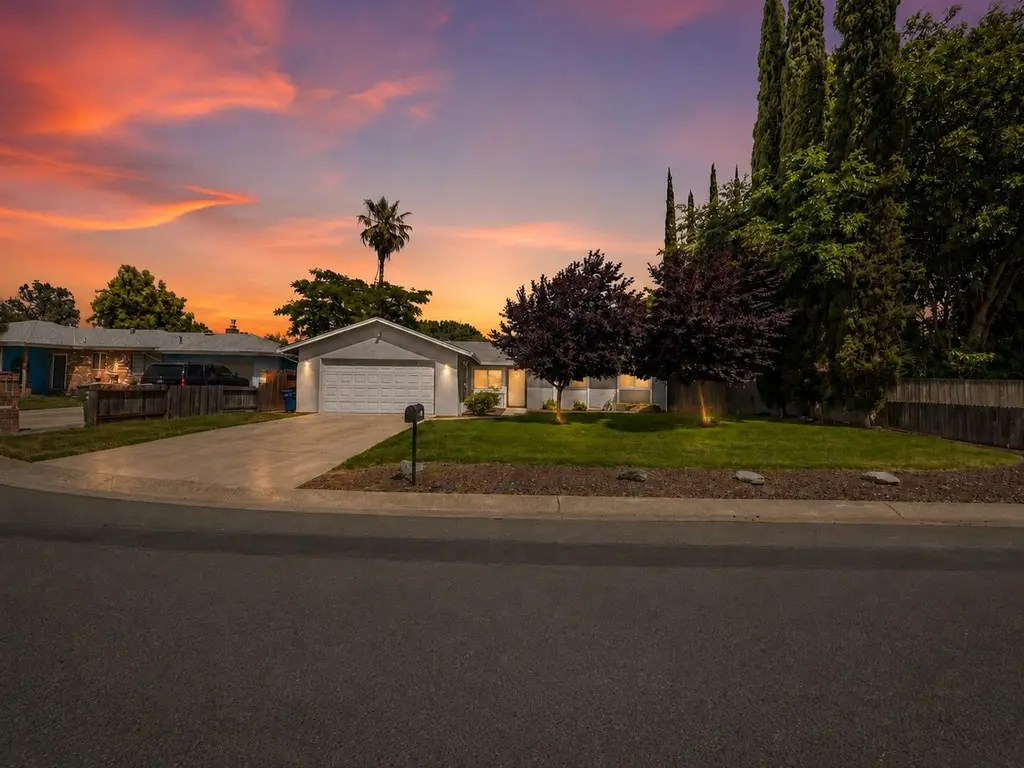
1543 John Pl
Yuba City, CA 95993
$369,000D+
4 bd · 2.0 ba ·
1,410 sqft ·
Built 1974
· SingleFamily
· Pending
· 7 DOM
Cashflow @ list (25.0% down · 7.5%)
Estimated rent
$2,794/mo
Mortgage (P&I)
−$1,935
Tax + insurance
−$312
HOA
−$0
Vac / Maint / Mgmt
−$587
Net cashflow
$-40/mo
Annual
$-474/yr
Cap rate
6.16%
Cash-on-cash
-0.46%
DSCR
0.98
1% rule
0.76%
Cash to close
$103,320
Investor read
- This is a 4-bed/2.0-bath single-family listed at $369k.
- At list price, monthly cash flow is $-40 ($-474/yr) — negative.
- To cash-flow at today's rent, offer at most $362k (1.9% below list).
- To meet the 1% rule (rent ≥ 1% of price), the offer needs to be $279k (24.3% below list).
- Only 7 days on market — expect competitive offers; lowballing is unlikely to land.
- Recommended offer: $279k (24.3% below list) — sets the bar for 1% rule.
- Local home prices are declining (-3.0%/yr); year-one equity from $3k of loan paydown is wiped out by about $11k of value loss. Plan a longer hold.
- Location reads 75/100 on livability (#111 in CA, #3,863 nationally) — a middle-class / working-renter tenant base. Strengths: commute A+, housing A+, health & safety A+; Watch: crime D+, schools D, cost of living F.
- Yuba City Unified (urban): math 20% / reading 53% proficiency, ranked #263 of 517 in CA (top 51%) — families likely to look elsewhere, expect single-tenant / working-renter base with shorter leases.
- Market conditions: 176 active listings in the ZIP; 1 comparable units currently listed for rent nearby; solid renter incomes; 73 units permitted in Sutter County in 2024 (0 in 5+ unit buildings).
- Sutter County population projected to shrink 4% by 2050 — rents likely to lag national; underwrite the cash flow, not the appreciation.
- Current owner paid $94k; list at $369k implies a 295% gain — meaningful room to come down on a strong offer.
- Climate carrying-cost: major wildfire risk; extreme-heat days projected 7→16/yr by 2055 (HVAC capex compounding) — expect insurance premiums to compound above CPI over the hold.
- Cap rate 6.2% vs local median 3.6% in Yuba City — top-decile yield for the area; either an underpriced asset or a hidden risk that comps aren't pricing in. Stress-test before assuming the spread holds.
- This rent runs 36% of the median local income ($94k/yr) — at the standard rent-burdened threshold; future hikes will face affordability resistance.
Questions for listing agent
- What do current leases actually rent for vs. the listed asking? Can we see a recent rent roll and the last 12 months of T-12 income?
- Built in 1974 — when were the roof, HVAC, electrical panel, plumbing, and water heater last replaced?
- Is there a deadline driving the sale (1031 exchange, divorce, estate, relocation)? That informs how much negotiation room exists.
- Schools are D-rated, which usually means shorter tenancies and higher turnover. Who's the typical renter profile here, and what's been the actual vacancy rate?
- Crime grade is D in this area — have there been break-ins, vandalism, or insurance claims at this property in the last 3 years? What carrier currently insures it and at what premium?
- The area grade is low — what's the realistic commute time and amenity access for the typical tenant pool here? Any planned neighborhood developments (good or bad) we should know about?
- What's the average days-on-market for RENTAL listings here right now (not sales)? A rising rental-DOM trend means longer vacancies and softer asking-rent achievability than the comps imply.
- What's the recent tenant-quality profile in this submarket — average credit score on applications, eviction rate, late-payment / NSF rate, and stable-employment percentage? A property-management company in the area should have these aggregated.
CashFlowRE · CFR-PJTR6WD6GTHW2E
· Data 3 weeks ago
cashflowre.app · 2026-05-29