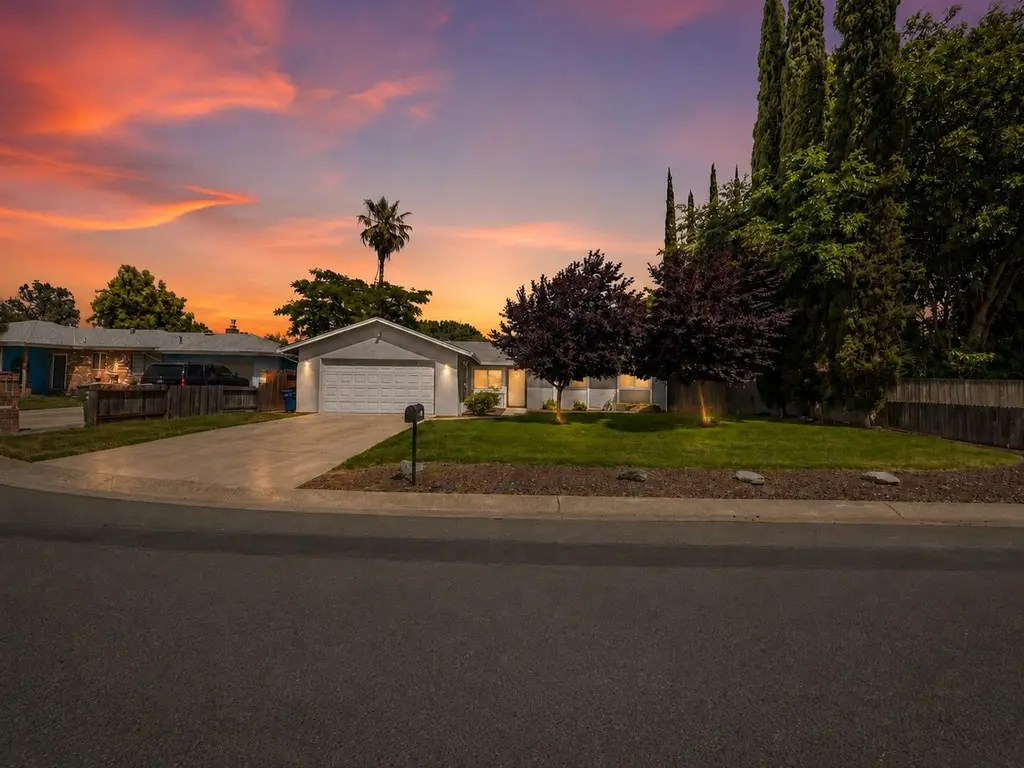
1543 John Pl · Yuba City, CA
Flood risk 1/10 · Minimal
- FEMA flood zone
- X
- Chance of flooding over 30 yrs
- 0.0%
- Est. flood insurance / yr
- $507 – $1,088
Fire risk 7/10 · Major
- Est. fire insurance / yr
- $659 – $1,223
Heat risk 7/10 · Major
- Hot days now (above 105°F)
- 7 days/yr
- Hot days in 30 yrs
- 16 days/yr
Wind risk 1/10 · Minimal
- Chance of severe wind over 30 yrs
- —
Air-quality risk 10/10 · Severe
- Unhealthy air days now
- 28 days/yr
- Unhealthy air days in 30 yrs
- 32 days/yr
Risk factors via First Street. Map © Google.
Why this score? — see what drove the D+ grade
The composite is a weighted blend of 9 inputs, each scored 0–100. Each bar is that input's sub-score; the figure is the points it added to the 100-point composite (weight × sub-score).
- ARV discount +14.1/15.0
- Cash flow +12.7/30.0
- DSCR +3.8/10.0
- Livability +3.8/5.0
- Schools +3.2/10.0
- 1% rule +2.6/10.0
- Rent growth +2.5/5.0
- Condition / age +2.5/5.0
- Appreciation +0.0/10.0
$369,000
🖨 Deal sheet 📄 Offer letter ✓ Due diligence
Listing remarks
Welcome to 1543 John Place in Yuba City! Tucked away in a quiet cul-de-sac, this beautifully updated 3 bedroom, 2 bathroom home offers approximately 1,410 sq. ft. of comfortable living space on an almost quarter-acre lot. Inside, you'll find an updated kitchen, remodeled bathrooms, upgraded exterior windows, brand-new carpet, and a beautiful brick fireplace that gives the home a warm and inviting feel. The home also comes with a refrigerator, making it even more move-in ready for the next owner. The spacious lot provides plenty of room for entertaining, gardening, RV parking potential, or simply enjoying the privacy of the backyard. There is also a small concrete slab in the backyard that w
Key facts
- 0.23 acre lot
- 2 garage spots
- Built 1974
Neighborhood map
What this means for you Summary
Snapshot
- This is a 4-bed/2.0-bath single-family listed at $369k.
Deal economics
- At list price, monthly cash flow is $-40 ($-474/yr) — negative.
- To cash-flow at today's rent, offer at most $362k (1.9% below list).
- To meet the 1% rule (rent ≥ 1% of price), the offer needs to be $279k (24.3% below list).
- Recommended offer: $279k (24.3% below list) — sets the bar for 1% rule.
- Cap rate 6.2% vs local median 3.6% in Yuba City — top-decile yield for the area; either an underpriced asset or a hidden risk that comps aren't pricing in. Stress-test before assuming the spread holds.
Location & tenants
- Location reads 75/100 on livability (#111 in CA, #3,863 nationally) — a middle-class / working-renter tenant base. Strengths: commute A+, housing A+, health & safety A+; Watch: crime D+, schools D, cost of living F.
- Yuba City Unified (urban): math 20% / reading 53% proficiency, ranked #263 of 517 in CA (top 51%) — families likely to look elsewhere, expect single-tenant / working-renter base with shorter leases.
- Market conditions: 176 active listings in the ZIP; 1 comparable units currently listed for rent nearby; solid renter incomes; 73 units permitted in Sutter County in 2024 (0 in 5+ unit buildings).
- This rent runs 36% of the median local income ($94k/yr) — at the standard rent-burdened threshold; future hikes will face affordability resistance.
Forward outlook
- Local home prices are declining (-3.0%/yr); year-one equity from $3k of loan paydown is wiped out by about $11k of value loss. Plan a longer hold.
- Sutter County population projected to shrink 4% by 2050 — rents likely to lag national; underwrite the cash flow, not the appreciation.
Negotiation context
- Only 7 days on market — expect competitive offers; lowballing is unlikely to land.
- Current owner paid $94k; list at $369k implies a 295% gain — meaningful room to come down on a strong offer.
Risks & watch-outs
- Climate carrying-cost: major wildfire risk; extreme-heat days projected 7→16/yr by 2055 (HVAC capex compounding) — expect insurance premiums to compound above CPI over the hold.
Questions for the listing agent
- What do current leases actually rent for vs. the listed asking? Can we see a recent rent roll and the last 12 months of T-12 income?
- Built in 1974 — when were the roof, HVAC, electrical panel, plumbing, and water heater last replaced?
- Is there a deadline driving the sale (1031 exchange, divorce, estate, relocation)? That informs how much negotiation room exists.
- Schools are D-rated, which usually means shorter tenancies and higher turnover. Who's the typical renter profile here, and what's been the actual vacancy rate?
- Crime grade is D in this area — have there been break-ins, vandalism, or insurance claims at this property in the last 3 years? What carrier currently insures it and at what premium?
- The area grade is low — what's the realistic commute time and amenity access for the typical tenant pool here? Any planned neighborhood developments (good or bad) we should know about?
- What's the average days-on-market for RENTAL listings here right now (not sales)? A rising rental-DOM trend means longer vacancies and softer asking-rent achievability than the comps imply.
- What's the recent tenant-quality profile in this submarket — average credit score on applications, eviction rate, late-payment / NSF rate, and stable-employment percentage? A property-management company in the area should have these aggregated.
- How much new for-sale + rental construction is in the pipeline within 1–3 miles? Heavy new supply typically softens prices + rents 12–24 months out; constrained supply supports both.
Investment metrics
- 1% rule
- 0.76% ✗
- Cap rate
- 6.16%
- Cash-on-cash
- -0.46%
- DSCR
- 0.98
- GRM
- 11.0
CMA / ARV
- ARV (median comp)
- $432,067
- List price
- $369,000
- Delta
- -14.60%
- Verdict
- UNDERPRICED
- Comps
- 20 within 1.0 mi
Show comp detail 12 sales within ~0.75 mi
| Address | Dist | Beds/Ba | Sqft | Sold | Price | $/sf | Match |
|---|---|---|---|---|---|---|---|
| 1543 John Pl | 0.00mi | 3/2.0 (-1) | 1,410 (0%) | 0mo | $376,000 | $267 | 95 |
| 2793 Coy Dr | 0.25mi | 3/2.0 (-1) | 1,352 (-4%) | 2mo | $439,999 | $325 | 75 |
| 2810 Kennedy Dr | 0.09mi | 3/2.0 (-1) | 1,526 (+8%) | 4mo | $460,000 | $301 | 74 |
| 2588 Sombra Ct | 0.38mi | 3/2.0 (-1) | 1,327 (-6%) | 2mo | $420,000 | $317 | 66 |
| 2768 Butte House Rd | 0.34mi | 3/2.0 (-1) | 1,500 (+6%) | 4mo | $438,000 | $292 | 65 |
| 2903 Kennedy Dr | 0.02mi | 3/2.0 (-1) | 1,588 (+13%) | 10mo | $425,000 | $268 | 65 |
| 1636 Piner Way | 0.69mi | 3/2.0 (-1) | 1,501 (+6%) | 0mo | $457,000 | $304 | 52 |
| 1616 Piner Way | 0.69mi | 3/2.0 (-1) | 1,501 (+6%) | 2mo | $453,000 | $302 | 50 |
| 2195 Roesler Dr | 0.69mi | 3/2.0 (-1) | 1,501 (+6%) | 6mo | $450,000 | $300 | 47 |
| 2204 Roesler Dr | 0.69mi | 3/2.0 (-1) | 1,501 (+6%) | 8mo | $460,000 | $306 | 45 |
| 2214 Roesler Dr | 0.69mi | 3/2.0 (-1) | 1,611 (+14%) | 9mo | $460,990 | $286 | 32 |
| 2187 Orlin Dr | 0.69mi | 3/2.0 (-1) | 1,611 (+14%) | 11mo | $469,000 | $291 | 30 |
Match score weights: distance 35% · size 25% · config 20% · recency 20%. Top-matched comps best support the ARV.
Projected returns pro-forma
-3.0% appreciation · 3.0% rent growth · sell at horizon
- IRR
- -17.1%
- Equity multiple
- 0.40×
- Total profit
- $-62,455
- Equity at exit
- $55,019
- IRR
- -9.1%
- Equity multiple
- 0.44×
- Total profit
- $-58,212
- Equity at exit
- $31,904
Cash invested: $103,320 (down + closing). Projections, not guarantees.
Landlord ↔ Tenant lean methodology
- Overall (STATE)
- 18 Strongly Tenant-Friendly
- State California
- 18 Strongly Tenant-Friendly · D+13
- County
- — inherits STATE
- City
- — inherits STATE
ZIP-level market 95993
- Active inventory
- 176
- Price-to-rent
- 11.0×
Monthly cashflow live
- Estimated rent
- $2,794 medium interval (Pro) →
- Mortgage (P&I)
- −$1,935
- Tax from tax record
- −$158 /mo · $1,896/yr
- Insurance
- −$154
- HOA
- −$0
- Vacancy / Maint / Mgmt
- −$587
- Net cashflow
- $-40
Break-even live
UW: 25.0% down · 7.5% · 30yr · 1.5% tax · 5.0% vac · 8.0% maint · 8.0% mgmt
Financing live
Cash to close
- Down payment
- $92,250
- Closing costs
- $11,070
- Reserves months
- —
- Total cash needed
- —
Loan-product check · same deal, 3 products live
Conventional
25% down · 7.5% · 30yr
- Down + closing
- —
- Monthly P&I
- —
- Monthly cashflow
- —
- DSCR
- —
- Eligible?
- —
Personal DTI + credit; lowest rate.
DSCR
20% down · 8.5% · 30yr
- Down + closing
- —
- Monthly P&I
- —
- Monthly cashflow
- —
- DSCR
- —
- Eligible?
- —
No personal income docs; deal must DSCR.
Hard money
10% down · 12.0% · 12mo
- Down + closing
- —
- Monthly P&I
- —
- Monthly cashflow
- —
- DSCR
- —
- Eligible?
- —
Short-term bridge; refi at stabilization.
Rent comps 1 comps
| Address | Beds | Baths | Sqft | Rent | $/sqft | DOM | Units | Dist |
|---|---|---|---|---|---|---|---|---|
| 1694 Shay Way Yuba City, CA | 4.0 | 2.5 | 1744 | $2,400 | $1.38 | 13d | 1 | 1.06mi |
Listing history 2 events
-
1995-03-30soldstatus $93,500
-
1995-03-30soldstatus $93,500
ⓘ Source: listings_history table (triggers on properties + properties_extension) + one-shot
backfill from property_details.listing_events for pre-trigger history.
Tax reassessment forecast CA · Resets to sale price
- Current annual tax
- $1,896 · $158/mo
- Projected year-2 tax
- $2,804 · $234/mo
- Expected delta
- +$908/yr (+$76/mo · 47.9%)
ⓘ Screening estimate from a state-policy table — verify with the county assessor before closing.
Climate risk First Street
- Flood 1/10 Low FEMA zone X · 0% chance over 30 yrs
- Wildfire 7/10 Severe
- Heat 7/10 Severe 7 d/yr ≥105°F today · 16 d/yr by 30 yrs out
- Wind 1/10 Low
- Air quality 10/10 Extreme 28 unhealthy d/yr today · 32 by 30 yrs out
Nearby sold comps map
Loading sold comps map…
Walkable amenities ~0.75 mi
Loading nearby amenities…
Taxation est. · year 1
- Rental income
- $33,529
- − Mortgage interest
- −$20,670
- − Property taxes
- −$1,896
- − Insurance
- −$1,845
- − Repairs & maintenance
- −$2,682
- − Management
- −$2,682
- − Depreciation
- −$10,735
- Taxable loss
- −$6,981
- Est. tax savings @ 24.0%
- +$1,675
- After-tax cash flow
- $1,201/yr
For passive investors: Depreciation is non-cash, so a rental often shows a tax loss while cash-flowing — sheltering income. Rental losses are passive: they offset passive income freely, and up to $25,000/yr can offset ordinary (W-2) income if you actively participate and your MAGI is under $100k (phasing out to $0 by $150k); unused losses carry forward. On sale, claimed depreciation is recaptured at up to 25%, and gains may owe capital-gains tax (a 1031 exchange can defer both). Figures are a year-1 estimate at your 24.0% rate — not tax advice; consult a CPA.
Schools (NCES district)
- District
- Yuba City Unified
- NCES district ID
- 0643470
- Math proficiency
- 20% ▼ -10.00%
- Reading proficiency
- 53% ▲ 5.00%
- Median HH income
- $50,923
- Composite
- 31.55/100
- National rank
- #5956
- State rank
- #263 of 517 in CA
Livability — Yuba City
- Score
- 75/100
- State rank
- #111
- US rank
- #3863
Category grades
Schools grade is shown separately in the Schools card above.
Census & demographics
- Census place
- Yuba City, CA
- County
- Sutter County · 81,625 people
- City population
- 81,625
- Metro
- Yuba City, CA
- Population (ZIP)
- 39,046
- Household income
- $93,763
- Rent vs Own
- Severe rent burden
- 738.0
Population outlook (Sutter County) Hauer SSP2
- Today (2025)
- 97,244 people
- By 2030
- 97,170 · -0.1%
- By 2040
- 96,137 · -1.1%
- By 2050
- 93,604 · -3.7%
- By 2075
- 85,008 · -12.6%
- By 2100
- 71,584 · -26.4%
Race, ethnicity, and origin ACS 2023
- Neighborhood character
- Diverse neighborhood (Simpson 0.68)
- Race & ethnicity
- White 45% Asian 25% Hispanic / Latino 23% Two or more races 12% Black 1%
- Hispanic origin (detail)
- Mexican 21%
- Common ancestry
- Slovak 2% Italian 1% Russian 1%
- Foreign-born
- 23% · Canada, Vietnam
- Languages at home
- 65% English-only · Other Indo-European 20% Spanish 12% Other Asian/Pacific 1%
Political lean MEDSL · Sutter
- 2024 margin
- Solid R (+31.4) · D 33.1% · R 64.5% · Other 2.4%
- 2008→2024 swing
- -14.7pp toward R · 2008: -16.7pp · 2024: -31.4pp
- All cycles
- 2024: R+31.4 2020: R+16.4 2016: R+16.3 2012: R+21.8 2008: R+16.7
Not yet ingested
- Civics
- —
Market trends
- HPI YoY
- ▼ -280.05%
- Current HPI
- 210.9131
- Rent YoY
- —
- Metro
- Yuba City, CA
- State GDP YoY
- ▲ 3.21%
- F500 in state
- 116
Industry mix (Fortune 500 HQ in CA)
| Industry | F500 HQs | Revenue |
|---|---|---|
| Technology | 27 | $1,492B |
|
||
| Financial Services | 3 | $174B |
|
||
| Retail | 3 | $44B |
|
||
| Insurance | 3 | $26B |
|
||
| Media / Entertainment | 2 | $115B |
|
||
| Pharmaceuticals / Biotech | 2 | $62B |
|
||
Price history
+0.0% since first listed2 events — show timeline
- 1995-03-30 Sold (Public Records) $93,500 Public Records
- 1995-03-30 Sold (Public Records) $93,500 Public Records
Property tax history
+0.4%/yrLatest (2025): $1,896 · +1.6% YoY. Source: county tax records.
Cash-flow waterfall
monthlySold comps — $/sqft
last 12 mo · ≤1 miLoading sold comps…