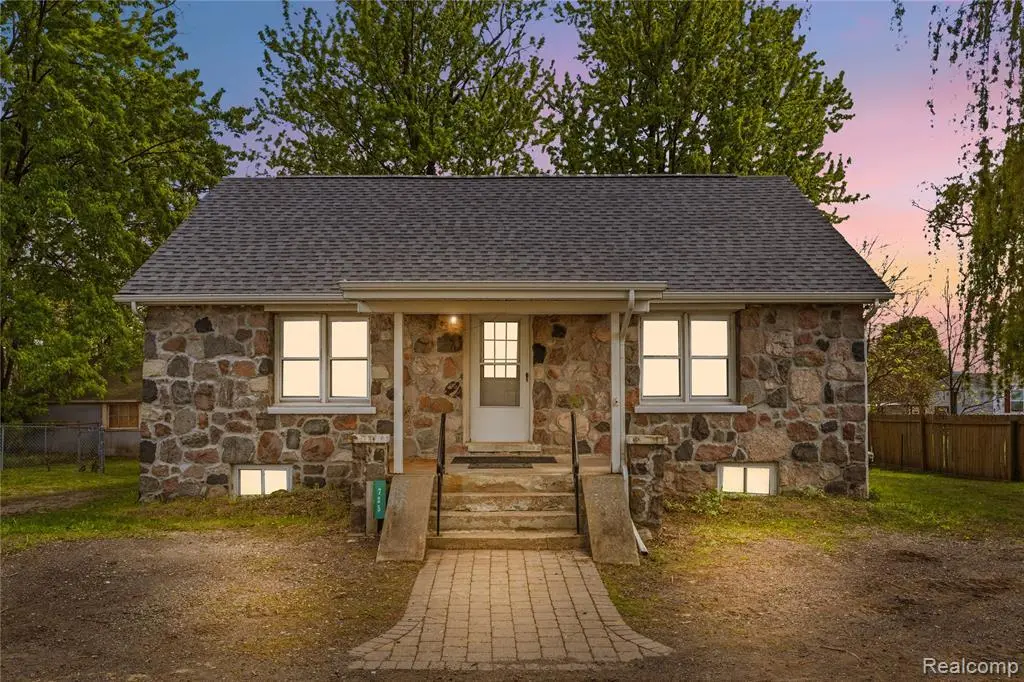
725 Mason Rd
Howell, MI 48843
$269,000C-
4 bd · 1.5 ba ·
1,884 sqft ·
Built 1995
· SingleFamily
· Pending
· 14 DOM
Cashflow @ list (25.0% down · 7.5%)
Estimated rent
$2,723/mo
Mortgage (P&I)
−$1,411
Tax + insurance
−$448
HOA
−$0
Vac / Maint / Mgmt
−$572
Net cashflow
$292/mo
Annual
$3,509/yr
Cap rate
7.60%
Cash-on-cash
4.66%
DSCR
1.21
1% rule
1.01%
Cash to close
$75,320
Investor read
- This is a 4-bed/1.5-bath single-family listed at $269k.
- At list price, monthly cash flow is $292 ($4k/yr) — positive.
- The deal already cash-flows at list — no discount required.
- Meets the 1% rule at list price ($3k rent vs $269k).
- Only 14 days on market — expect competitive offers; lowballing is unlikely to land.
- Local home prices are declining (-3.0%/yr); year-one equity from $2k of loan paydown is wiped out by about $8k of value loss. Plan a longer hold.
- Location reads 78/100 on livability (#107 in MI, #2,598 nationally) — a middle-class / working-renter tenant base. Strengths: crime A+, cost of living A+, housing A+; Watch: commute F.
- Howell Public Schools (suburban): math 41% / reading 52% proficiency, ranked #116 of 540 in MI (top 22%) — families likely to look elsewhere, expect single-tenant / working-renter base with shorter leases.
- Zoned schools: Southwest Elementary School (math 46% / reading 52%, grade D, #425 of 1,397 statewide, top 31%, 551 students, 38% FRL); Parker Middle School (math 38% / reading 53%, grade D+, #161 of 493 statewide, top 33%, 741 students, 34% FRL); Howell High School (math 36% / reading 60%, grade D, #183 of 713 statewide, top 26%, 2,024 students, 25% FRL).
- Market conditions: 345 active listings in the ZIP; 2 comparable units currently listed for rent nearby; solid renter incomes; 488 units permitted in Livingston County in 2024 (0 in 5+ unit buildings).
- Livingston County population projected at +7% by 2050 — modest demand growth; plan on rents tracking national, not racing it.
- 15 sale attempts since 29y ago with the ask held roughly flat each time — persistent listings suggest the price (not the market) is what's stuck; bring a comps-based counter.
- Cap rate 7.6% vs local median 3.4% in Howell — top-decile yield for the area; either an underpriced asset or a hidden risk that comps aren't pricing in. Stress-test before assuming the spread holds.
- This rent runs 35% of the median local income ($95k/yr) — at the standard rent-burdened threshold; future hikes will face affordability resistance.
Questions for listing agent
- Is there a deadline driving the sale (1031 exchange, divorce, estate, relocation)? That informs how much negotiation room exists.
- What's the average days-on-market for RENTAL listings here right now (not sales)? A rising rental-DOM trend means longer vacancies and softer asking-rent achievability than the comps imply.
- What's the recent tenant-quality profile in this submarket — average credit score on applications, eviction rate, late-payment / NSF rate, and stable-employment percentage? A property-management company in the area should have these aggregated.
- How much new for-sale + rental construction is in the pipeline within 1–3 miles? Heavy new supply typically softens prices + rents 12–24 months out; constrained supply supports both.
CashFlowRE · CFR-PKHNY2EQ3CRBS7
· Data 3 weeks ago
cashflowre.app · 2026-05-29