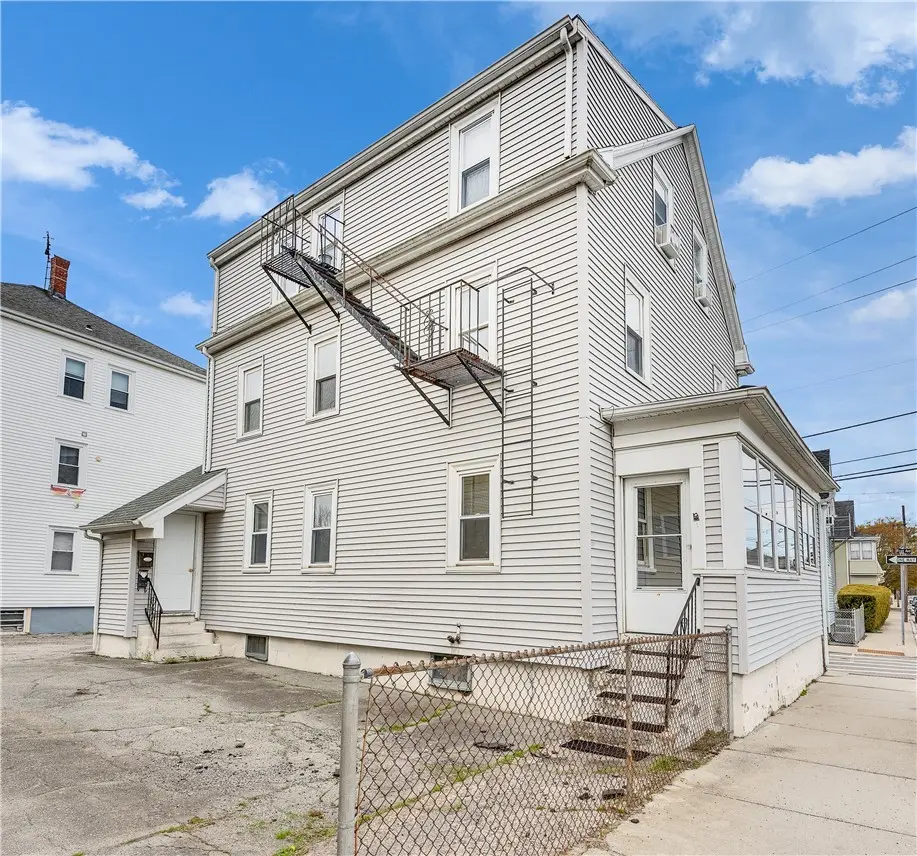
221 State St
Bristol, RI 02809
$629,000C+
6 bd · 3.0 ba ·
2,468 sqft ·
Built 1925
· MultiFamily
· Active
· 41 DOM
Cashflow @ list (25.0% down · 7.5%)
Estimated rent
$6,405/mo
Mortgage (P&I)
−$3,299
Tax + insurance
−$602
HOA
−$0
Vac / Maint / Mgmt
−$1,345
Net cashflow
$1,160/mo
Annual
$13,918/yr
Cap rate
8.51%
Cash-on-cash
7.90%
DSCR
1.35
1% rule
1.02%
Cash to close
$176,120
Investor read
- This is a 3 × 2-bed/1.0-bath units multifamily listed at $629k.
- At list price, monthly cash flow is $1k ($14k/yr) — positive. Per door: $387/mo.
- The deal already cash-flows at list — no discount required.
- Meets the 1% rule at list price ($6k rent vs $629k).
- It's been on market 41 days — a 3% lower offer ($610k) is reasonable based on typical stale-listing flexibility.
- Recommended offer: $610k (3.0% below list) — sets the bar for market timing.
- Local home prices are declining (-3.0%/yr); year-one equity from $4k of loan paydown is wiped out by about $19k of value loss. Plan a longer hold.
- Location reads: area grade C — affects rentability + tenant quality, not the cash-flow math above.
- Bristol Warren (suburban): math 28% / reading 49% proficiency, ranked #18 of 39 in RI (top 46%) — families likely to look elsewhere, expect single-tenant / working-renter base with shorter leases.
- Watch-outs: built in 1925 — expect roof / HVAC / electrical / plumbing capex.
- Market conditions: Rents rising fast (+8.2%/yr); 80 active listings in the ZIP; solid renter incomes; 29 units permitted in Bristol County in 2024 (0 in 5+ unit buildings).
- Bristol County population projected at -12% by 2050 — secular population decline; favor cash flow + early exit over multi-decade hold.
- 3 sale attempts since 19y ago with the ask held roughly flat each time — persistent listings suggest the price (not the market) is what's stuck; bring a comps-based counter.
- At projected returns (-3.0% appreciation + 8.0% rent growth), your $176k cash investment doubles in ~9 years — after that, you're playing with house money.
- Climate carrying-cost: severe wind risk, 80% chance of damaging wind over 30y; extreme-heat days projected 7→16/yr by 2055 (HVAC capex compounding) — expect insurance premiums to compound above CPI over the hold.
- At $6,405/mo this rent would consume 79% of the median local household income ($98k/yr) (locally 649% of renters already pay >50% of income on rent) — very limited rent-growth headroom before tenants either downsize or default.
Questions for listing agent
- It's been on market 41 days. Have you received any prior offers? Is the seller open to a 3% concession, seller financing, or rate buy-down credit?
- Can we see the unit-by-unit rent roll, current vacancy, and any below-market leases? What's the average tenancy length?
- What capital expenditures (roof, boiler, parking lot, exteriors) have been made in the last 5 years, and what's planned in the next 2?
- Built in 1925 — when were the roof, HVAC, electrical panel, plumbing, and water heater last replaced?
- Is there a deadline driving the sale (1031 exchange, divorce, estate, relocation)? That informs how much negotiation room exists.
- What's the average days-on-market for RENTAL listings here right now (not sales)? A rising rental-DOM trend means longer vacancies and softer asking-rent achievability than the comps imply.
- What's the recent tenant-quality profile in this submarket — average credit score on applications, eviction rate, late-payment / NSF rate, and stable-employment percentage? A property-management company in the area should have these aggregated.
- How much new apartment / multifamily construction is in the pipeline within 1–3 miles? Heavy new supply (>2% of stock underway) typically softens rents 12–24 months out; light construction supports rent growth.
CashFlowRE · CFR-PMDQEM9KMFT1WF
· Data 1 day ago
cashflowre.app · 2026-05-29