 Triplex
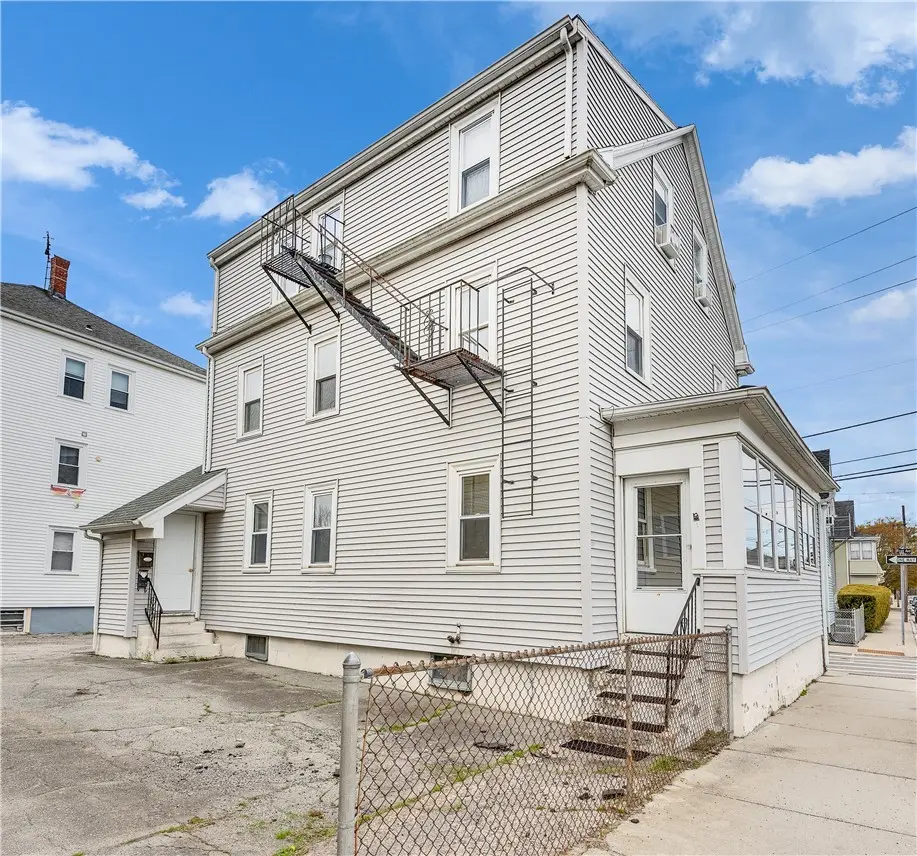
221 State St · Bristol, RI
Flood risk 1/10 · Minimal
- FEMA flood zone
- X (unshaded)
- Chance of flooding over 30 yrs
- 0.0%
- Est. flood insurance / yr
- $473 – $860
Fire risk 1/10 · Minimal
- Est. fire insurance / yr
- $835 – $1,551
Heat risk 5/10 · Moderate
- Hot days now (above 95°F)
- 7 days/yr
- Hot days in 30 yrs
- 16 days/yr
Wind risk 8/10 · Major
- Chance of severe wind over 30 yrs
- 80.0%
Air-quality risk 2/10 · Minimal
- Unhealthy air days now
- 2 days/yr
- Unhealthy air days in 30 yrs
- 2 days/yr
Risk factors via First Street. Map © Google.
Why this score? — see what drove the C+ grade
The composite is a weighted blend of 9 inputs, each scored 0–100. Each bar is that input's sub-score; the figure is the points it added to the 100-point composite (weight × sub-score).
- Cash flow +23.4/30.0
- ARV discount +14.8/15.0
- DSCR +7.5/10.0
- 1% rule +5.2/10.0
- Rent growth +4.5/5.0
- Schools +3.4/10.0
- Livability +2.5/5.0
- Condition / age +2.5/5.0
- Appreciation +0.0/10.0
$629,000
🖨 Deal sheet 📄 Offer letter ✓ Due diligence
Multi-family units
County records classify this as Multi-Family (2-4 Unit). Listing-text estimate: 3 units. confirmed
Listing remarks
Three-Family Opportunity in Bristol. Offered for the first time in over 80 years, this well-located three-family home presents a rare opportunity for investors or owner-occupants alike. Long held by the same family, this property offers solid fundamentals and the chance to add value over time. Ideally situated just a short distance to Unity Park, the town common, and downtown Bristol, with its array of restaurants, shops and museums. The second floor unit features three bedrooms, one full bathroom , the first and third floor features two bedrooms, one full bathroom and functional layouts with good natural light. The first floor unit has two private entrances and includes a sunroom, providi
Key facts
- Private entrances
- Sunroom
- 1,961 sq ft lot
Tags
Property features AI
Finance
- Financial info: Property configured as three income units (two 2-bedrooms and one 3-bedroom); One unit reported rent: $1,000 (lease)
- HOA & community: Community amenities include nearby schools, public transportation, recreation area, restaurant, tennis courts, and sidewalks
Exterior
- Parking: No garage; Two off-street parking spaces (total)
- Utilities: Sewer connected; Water connected; Electrical service: 100 amp
- Home design: Multi-unit building (3 units) in one building; 3 stories
- Construction: Plaster and vinyl siding exterior
- Exterior features: Corner lot; Near public transportation; Sidewalks; Nearby recreation area, restaurants, and tennis courts
Interior
- Kitchen: Oven; Range; Refrigerator
- Bedrooms: Property contains multiple units: two 2-bedroom units and one 3-bedroom unit
- Flooring: Hardwood; Laminate; Carpet
- Bathrooms: Three full bathrooms total; Each unit includes one full bathroom
- Heating & cooling: Heating present; Gas heating; Hot water heating; Oil heating
- Interior features: Storm windows; Storm doors; Tub with shower
- Laundry & utility: Utility room; Gas water heater; Water heater (rented option noted)
Neighborhood map
What this means for you Summary
Snapshot
- This is a 3 × 2-bed/1.0-bath units multifamily listed at $629k.
Deal economics
- At list price, monthly cash flow is $1k ($14k/yr) — positive. Per door: $387/mo.
- The deal already cash-flows at list — no discount required.
- Meets the 1% rule at list price ($6k rent vs $629k).
- Recommended offer: $610k (3.0% below list) — sets the bar for market timing.
Location & tenants
- Location reads: area grade C — affects rentability + tenant quality, not the cash-flow math above.
- Bristol Warren (suburban): math 28% / reading 49% proficiency, ranked #18 of 39 in RI (top 46%) — families likely to look elsewhere, expect single-tenant / working-renter base with shorter leases.
- Market conditions: Rents rising fast (+8.2%/yr); 80 active listings in the ZIP; solid renter incomes; 29 units permitted in Bristol County in 2024 (0 in 5+ unit buildings).
- At $6,405/mo this rent would consume 79% of the median local household income ($98k/yr) (locally 649% of renters already pay >50% of income on rent) — very limited rent-growth headroom before tenants either downsize or default.
Forward outlook
- Local home prices are declining (-3.0%/yr); year-one equity from $4k of loan paydown is wiped out by about $19k of value loss. Plan a longer hold.
- Bristol County population projected at -12% by 2050 — secular population decline; favor cash flow + early exit over multi-decade hold.
- At projected returns (-3.0% appreciation + 8.0% rent growth), your $176k cash investment doubles in ~9 years — after that, you're playing with house money.
Negotiation context
- It's been on market 41 days — a 3% lower offer ($610k) is reasonable based on typical stale-listing flexibility.
- 3 sale attempts since 19y ago with the ask held roughly flat each time — persistent listings suggest the price (not the market) is what's stuck; bring a comps-based counter.
Risks & watch-outs
- Watch-outs: built in 1925 — expect roof / HVAC / electrical / plumbing capex.
- Climate carrying-cost: severe wind risk, 80% chance of damaging wind over 30y; extreme-heat days projected 7→16/yr by 2055 (HVAC capex compounding) — expect insurance premiums to compound above CPI over the hold.
Questions for the listing agent
- It's been on market 41 days. Have you received any prior offers? Is the seller open to a 3% concession, seller financing, or rate buy-down credit?
- Can we see the unit-by-unit rent roll, current vacancy, and any below-market leases? What's the average tenancy length?
- What capital expenditures (roof, boiler, parking lot, exteriors) have been made in the last 5 years, and what's planned in the next 2?
- Built in 1925 — when were the roof, HVAC, electrical panel, plumbing, and water heater last replaced?
- Is there a deadline driving the sale (1031 exchange, divorce, estate, relocation)? That informs how much negotiation room exists.
- What's the average days-on-market for RENTAL listings here right now (not sales)? A rising rental-DOM trend means longer vacancies and softer asking-rent achievability than the comps imply.
- What's the recent tenant-quality profile in this submarket — average credit score on applications, eviction rate, late-payment / NSF rate, and stable-employment percentage? A property-management company in the area should have these aggregated.
- How much new apartment / multifamily construction is in the pipeline within 1–3 miles? Heavy new supply (>2% of stock underway) typically softens rents 12–24 months out; light construction supports rent growth.
Investment metrics
- 1% rule
- 1.02% ✓
- Cap rate
- 8.51%
- Cash-on-cash
- 7.90%
- DSCR
- 1.35
- GRM
- 8.2
CMA / ARV
- ARV (on-the-fly)
- $750,272
- Comps found
- 8
Show comp detail 8 sales within ~0.75 mi
| Address | Dist | Beds/Ba | Sqft | Sold | Price | $/sf | Match |
|---|---|---|---|---|---|---|---|
| 2 Chilton St | 0.23mi | 7/4.0 (+1) | 2,436 (-1%) | 2mo | $740,000 | $304 | 77 |
| 30 Catherine St | 0.25mi | 6/3.0 | 2,574 (+4%) | 7mo | $770,000 | $299 | 76 |
| 32 Pearse Ave | 0.25mi | 5/3.0 (-1) | 2,464 (-0%) | 20mo | $558,000 | $226 | 66 |
| 34 Central | 0.37mi | 5/2.0 (-1) | 2,522 (+2%) | 7mo | $640,000 | $254 | 64 |
| 17 Prospect St | 0.22mi | 6/3.0 | 2,652 (+8%) | 23mo | $650,000 | $245 | 58 |
| 156 Mount Hope Ave | 0.32mi | 6/2.0 | 2,260 (-8%) | 20mo | $725,000 | $321 | 50 |
| 282 Thames St | 0.48mi | 5/3.0 (-1) | 2,676 (+8%) | 16mo | $850,000 | $318 | 45 |
| 260 Hope St | 0.48mi | 5/3.0 (-1) | 2,682 (+9%) | 18mo | $825,000 | $308 | 43 |
Match score weights: distance 35% · size 25% · config 20% · recency 20%. Top-matched comps best support the ARV.
Projected returns pro-forma
-3.0% appreciation · 8.0% rent growth · sell at horizon
- IRR
- 0.8%
- Equity multiple
- 1.03×
- Total profit
- $5,616
- Equity at exit
- $93,786
- IRR
- 14.7%
- Equity multiple
- 2.44×
- Total profit
- $253,347
- Equity at exit
- $54,384
Cash invested: $176,120 (down + closing). Projections, not guarantees.
Landlord ↔ Tenant lean methodology
- Overall (STATE)
- 31 Tenant-Leaning
- State Rhode Island
- 31 Tenant-Leaning · D+8
- County
- — inherits STATE
- City
- — inherits STATE
ZIP-level market 02809
- Home prices YoY
- -30.2%
- Rents YoY
- 8.2%
- Active inventory
- 80
- Price-to-rent
- 24.6×
Monthly cashflow live
- Estimated rent
- $6,405 high interval (Pro) →
- Mortgage (P&I)
- −$3,299
- Tax from tax record
- −$340 /mo · $4,074/yr
- Insurance
- −$262
- HOA
- −$0
- Vacancy / Maint / Mgmt
- −$1,345
- Net cashflow
- $1,160
Break-even live
3-unit breakdown (identical units grouped — click to expand)
| Units | Beds | Baths | Est. rent |
|---|---|---|---|
| 3× units | 2 | 1 | $6,405 |
| #1 | 2 | 1 | $2,135 |
| #2 | 2 | 1 | $2,135 |
| #3 | 2 | 1 | $2,135 |
| Total (3 units) | $6,405 | ||
UW: 25.0% down · 7.5% · 30yr · 1.5% tax · 5.0% vac · 8.0% maint · 8.0% mgmt
Financing live
Cash to close
- Down payment
- $157,250
- Closing costs
- $18,870
- Reserves months
- —
- Total cash needed
- —
Loan-product check · same deal, 3 products live
Conventional
25% down · 7.5% · 30yr
- Down + closing
- —
- Monthly P&I
- —
- Monthly cashflow
- —
- DSCR
- —
- Eligible?
- —
Personal DTI + credit; lowest rate.
DSCR
20% down · 8.5% · 30yr
- Down + closing
- —
- Monthly P&I
- —
- Monthly cashflow
- —
- DSCR
- —
- Eligible?
- —
No personal income docs; deal must DSCR.
Hard money
10% down · 12.0% · 12mo
- Down + closing
- —
- Monthly P&I
- —
- Monthly cashflow
- —
- DSCR
- —
- Eligible?
- —
Short-term bridge; refi at stabilization.
Listing history 21 events
-
2026-06-18days on market $629,000 Active 41 DOM
-
2026-06-17days on market $629,000 Active 40 DOM
-
2026-06-16pricedays on market $629,000 Active 39 DOM
-
2026-06-15days on market $659,000 Active 38 DOM
-
2026-06-13days on market $659,000 Active 36 DOM
-
2026-06-13days on market $659,000 Active 35 DOM
-
2026-06-09days on market $659,000 Active 32 DOM
-
2026-06-08days on market $659,000 Active 31 DOM
-
2026-06-07days on market $659,000 Active 30 DOM
-
2026-06-05days on market $659,000 Active 27 DOM
-
2026-06-03days on market $659,000 Active 26 DOM
-
2026-06-02days on market $659,000 Active 25 DOM
-
2026-06-01days on market $659,000 Active 24 DOM
-
2026-05-31days on market $659,000 Active 23 DOM
-
2026-05-08$659,000 Active
-
2016-11-08price $309,900
-
2013-12-19price $204,900
-
2013-09-30historical
-
2012-07-25$269,900
-
2008-07-11historical
-
2007-11-23$320,000
ⓘ Source: listings_history table (triggers on properties + properties_extension) + one-shot
backfill from property_details.listing_events for pre-trigger history.
Tax reassessment forecast RI · Partial reset (capped growth)
- Current annual tax
- $4,074 · $340/mo
- Projected year-2 tax
- $7,163 · $597/mo
- Expected delta
- +$3,089/yr (+$257/mo · 75.8%)
ⓘ Screening estimate from a state-policy table — verify with the county assessor before closing.
Climate risk First Street
- Flood 1/10 Low FEMA zone X (unshaded) · 0% chance over 30 yrs
- Wildfire 1/10 Low
- Heat 5/10 Major 7 d/yr ≥95°F today · 16 d/yr by 30 yrs out
- Wind 8/10 Severe 80% chance of damaging wind over 30 yrs
- Air quality 2/10 Low 2 unhealthy d/yr today · 2 by 30 yrs out
Nearby sold comps map
Loading sold comps map…
Walkable amenities ~0.75 mi
Loading nearby amenities…
Taxation est. · year 1
- Rental income
- $76,860
- − Mortgage interest
- −$35,234
- − Property taxes
- −$4,074
- − Insurance
- −$3,145
- − Repairs & maintenance
- −$6,149
- − Management
- −$6,149
- − Depreciation
- −$18,298
- Taxable income
- $3,811
- Est. tax owed @ 24.0%
- −$915
- After-tax cash flow
- $13,003/yr
For passive investors: Depreciation is non-cash, so a rental often shows a tax loss while cash-flowing — sheltering income. Rental losses are passive: they offset passive income freely, and up to $25,000/yr can offset ordinary (W-2) income if you actively participate and your MAGI is under $100k (phasing out to $0 by $150k); unused losses carry forward. On sale, claimed depreciation is recaptured at up to 25%, and gains may owe capital-gains tax (a 1031 exchange can defer both). Figures are a year-1 estimate at your 24.0% rate — not tax advice; consult a CPA.
Schools (NCES district)
- District
- Bristol Warren
- NCES district ID
- 4400065
- Math proficiency
- 28% ▼ -13.00%
- Reading proficiency
- 49% ▼ -4.00%
- Median HH income
- $59,144
- Composite
- 34.05/100
- National rank
- #5306
- State rank
- #18 of 39 in RI
Livability — Bristol
No livability data for this city. (Only ~50 U.S. cities are tracked.)
Census & demographics
- County
- Bristol County · 33,364 people
- City population
- 22,220
- Metro
- Providence-Warwick, RI-MA
- Population (ZIP)
- 22,220
- Household income
- $97,764
- Rent vs Own
- Severe rent burden
- 649.0
Population outlook (Bristol County) Hauer SSP2
- Today (2025)
- 49,175 people
- By 2030
- 48,295 · -1.8%
- By 2040
- 45,652 · -7.2%
- By 2050
- 43,093 · -12.4%
- By 2075
- 38,508 · -21.7%
- By 2100
- 34,809 · -29.2%
Race, ethnicity, and origin ACS 2023
- Neighborhood character
- Predominantly White (91%)
- Race & ethnicity
- White 91% Two or more races 5% Hispanic / Latino 3% Asian 1% Black 1%
- Common ancestry
- Russian 17% Lithuanian 6% Romanian 3%
- Foreign-born
- 10% · Canada
- Languages at home
- 88% English-only · Other Indo-European 9% Spanish 1% Tagalog/Filipino 1%
Political lean MEDSL · Bristol
- 2024 margin
- Strong D (+26.4) · D 62.1% · R 35.7% · Other 2.2%
- 2008→2024 swing
- -0.4pp no change · 2008: 26.8pp · 2024: 26.4pp
- All cycles
- 2024: D+26.4 2020: D+29.2 2016: D+22.8 2012: D+23.3 2008: D+26.8
Not yet ingested
- Civics
- —
Market trends
- HPI YoY
- ▼ -162.42%
- Current HPI
- 374.7149
- Rent YoY
- ▲ 8.15%
- Metro
- Providence-Warwick, RI-MA
- State GDP YoY
- ▲ 2.25%
- F500 in state
- 10
Industry mix (Fortune 500 HQ in RI)
| Industry | F500 HQs | Revenue |
|---|---|---|
| Healthcare | 1 | $373B |
|
||
| Food Distribution | 1 | $31B |
|
||
| Aerospace / Defense | 1 | $14B |
|
||
| Financial Services | 1 | $8B |
|
||
| Consumer Goods | 1 | $4B |
|
||
Price history
+105.9% since first listed7 events — show timeline
- 2026-05-08 Listed $659,000 RIS
- 2016-11-08 Price Changed $309,900 RIS
- 2013-12-19 Price Changed $204,900 RIS
- 2013-09-30 Listing Removed — RIS
- 2012-07-25 Listed $269,900 RIS
- 2008-07-11 Listing Removed — RIS
- 2007-11-23 Listed $320,000 RIS
Property tax history
+3.9%/yrLatest (2024): $4,074 · +3.4% YoY. Source: county tax records.
Cash-flow waterfall
monthlySold comps — $/sqft
last 12 mo · ≤1 miLoading sold comps…