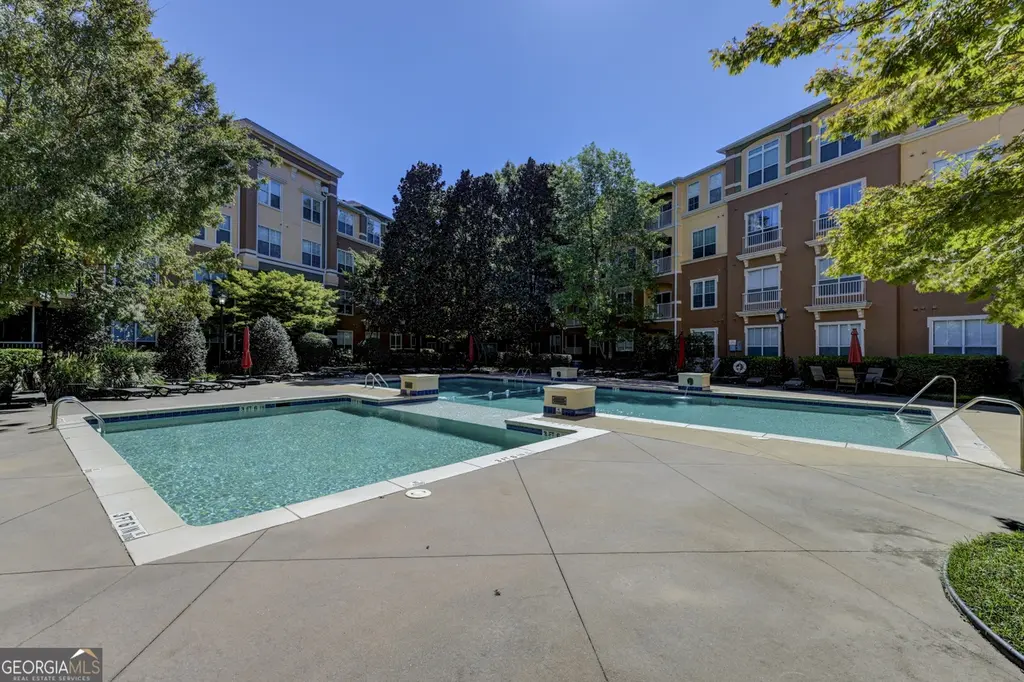
10 Perimeter Summit Blvd NE #3405
Brookhaven, GA 30319
$195,000F
1 bd · 1.0 ba ·
952 sqft ·
Built 2005
· Condo
· Active
· 98 DOM
Cashflow @ list (25.0% down · 7.5%)
Estimated rent
$1,576/mo
Mortgage (P&I)
−$1,023
Tax + insurance
−$250
HOA
−$690
Vac / Maint / Mgmt
−$331
Net cashflow
$-717/mo
Annual
$-8,605/yr
Cap rate
1.88%
Cash-on-cash
-15.76%
DSCR
0.30
1% rule
0.81%
Cash to close
$54,600
Investor read
- This is a 1-bed/1.0-bath condo listed at $195k.
- At list price, monthly cash flow is $-717 ($-9k/yr) — negative.
- To cash-flow at today's rent, offer at most $190k (2.5% below list).
- To meet the 1% rule (rent ≥ 1% of price), the offer needs to be $158k (19.2% below list).
- It's been on market 98 days — a 9% lower offer ($177k) is reasonable based on typical stale-listing flexibility.
- Recommended offer: $158k (19.2% below list) — sets the bar for 1% rule.
- Local home prices are declining (-3.0%/yr); year-one equity from $1k of loan paydown is wiped out by about $6k of value loss. Plan a longer hold.
- Location reads 77/100 on livability (#21 in GA, #3,126 nationally) — a middle-class / working-renter tenant base. Strengths: employment A+, housing A+, commute A-; Watch: schools C-, crime C-, cost of living F.
- Dekalb County (suburban): math 19% / reading 28% proficiency, ranked #125 of 174 in GA (top 72%) — low school quality limits family demand, transient renter base, plan for 1-2y turnover; 68% free/reduced lunch — lower-income household profile, screen leases tightly.
- Watch-outs: HOA is 44% of rent.
- Market conditions: Rents rising (+2.9%/yr); 384 active listings in the ZIP; 35 comparable units currently listed for rent nearby; rentals leasing fast (median 2d on market — plan ~1-2 weeks tenant-placement turnaround); high-income renter base; 1,240 units permitted in DeKalb County in 2024 (385 in 5+ unit buildings).
- DeKalb County population projected at +28% by 2050 — long-run rental-demand tailwind backs the buy-and-hold thesis.
- 10 sale attempts since 9y ago with the ask held roughly flat each time — persistent listings suggest the price (not the market) is what's stuck; bring a comps-based counter.
- Climate carrying-cost: extreme-heat days projected 7→17/yr by 2055 (HVAC capex compounding) — expect insurance premiums to compound above CPI over the hold.
- Cap rate 1.9% vs local median 2.6% in Brookhaven — below-typical yield; the buyer is paying a premium for something (appreciation thesis, condition, location) that the cap rate doesn't capture.
- This rent is only 14% of the median local income ($131k/yr) — well below the 30% rent-burden line; pricing power to push rent on renewal without tenant pushback.
Questions for listing agent
- What do current leases actually rent for vs. the listed asking? Can we see a recent rent roll and the last 12 months of T-12 income?
- It's been on market 98 days. Have you received any prior offers? Is the seller open to a 19% concession, seller financing, or rate buy-down credit?
- What does the HOA fee cover, when was the last increase, and are there any pending special assessments or reserve-fund shortfalls?
- Any open or pending special assessments — roof, HVAC, plumbing, elevator, façade? What's the per-unit balance and payoff schedule, and is the seller paying it off at close or rolling it to the buyer?
- Why hasn't it sold? Are there any deal-killer items the seller is aware of (foundation, flood, title, zoning, code violations)?
- Is there a deadline driving the sale (1031 exchange, divorce, estate, relocation)? That informs how much negotiation room exists.
- The area grade is low — what's the realistic commute time and amenity access for the typical tenant pool here? Any planned neighborhood developments (good or bad) we should know about?
- What's the average days-on-market for RENTAL listings here right now (not sales)? A rising rental-DOM trend means longer vacancies and softer asking-rent achievability than the comps imply.
CashFlowRE · CFR-PMNHEMF0Y23SNF
· Data 2 days ago
cashflowre.app · 2026-05-29