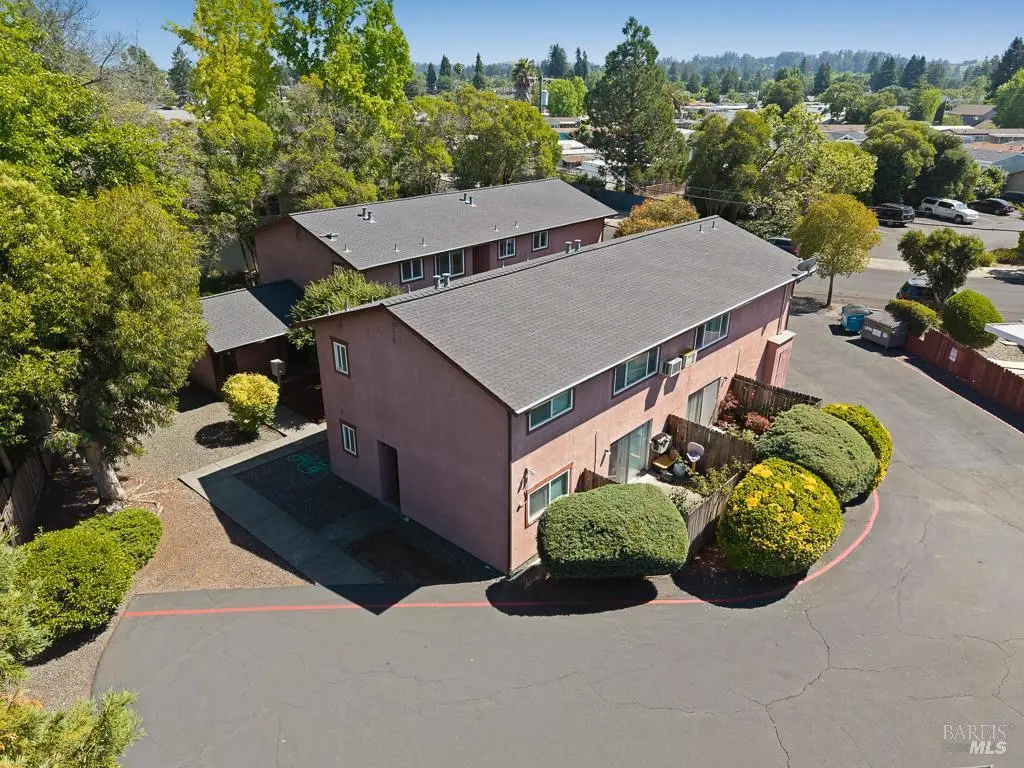
7488 Bridgit Dr
Rohnert Park, CA 94928
$1,730,000C-
12 bd · 8.0 ba ·
5,792 sqft ·
Built 1973
· MultiFamily
· Active
· 16 DOM
Cashflow @ list (25.0% down · 7.5%)
Estimated rent
$17,608/mo
Mortgage (P&I)
−$9,072
Tax + insurance
−$2,647
HOA
−$0
Vac / Maint / Mgmt
−$3,698
Net cashflow
$2,191/mo
Annual
$26,293/yr
Cap rate
7.81%
Cash-on-cash
5.43%
DSCR
1.24
1% rule
1.02%
Cash to close
$484,400
Investor read
- This is a 8 × 2-bed/1.0-bath units multifamily listed at $1.73M.
- At list price, monthly cash flow is $2k ($26k/yr) — positive. Per door: $274/mo.
- The deal already cash-flows at list — no discount required.
- Meets the 1% rule at list price ($18k rent vs $1.73M).
- It's been on market 16 days — a 2% lower offer ($1.70M) is reasonable based on typical stale-listing flexibility.
- Recommended offer: $1.70M (1.5% below list) — sets the bar for market timing.
- Local home prices are declining (-3.0%/yr); year-one equity from $12k of loan paydown is wiped out by about $52k of value loss. Plan a longer hold.
- Location reads 75/100 on livability (#116 in CA, #4,166 nationally) — a middle-class / working-renter tenant base. Strengths: commute A+, employment A+, health & safety A+; Watch: cost of living F.
- Cotati-Rohnert Park Unified (suburban): math 24% / reading 61% proficiency, ranked #205 of 517 in CA (top 40%) — families likely to look elsewhere, expect single-tenant / working-renter base with shorter leases.
- Zoned schools: John Reed Primary (378 students, 80% FRL); Technology Middle (math 24% / reading 24%, grade F, #277 of 498 statewide, top 73%, 426 students, 68% FRL); Rancho Cotate High (math 12% / reading 57%, grade F, #618 of 1,170 statewide, top 56%, 1,611 students, 36% FRL) — zoned schools average 61% FRL vs 36% district-wide (25 pts higher); higher-poverty schools than district average — tighter screening recommended.
- Zoned-school proficiency averages 30% at this address vs 42% district-wide (-13 pts) — the specific schools serving this property underperform the Cotati-Rohnert Park Unified average; the district grade overstates school quality for this exact location.
- Market conditions: Rents rising (+2.7%/yr); 100 active listings in the ZIP; solid renter incomes; 1,039 units permitted in Sonoma County in 2024 (185 in 5+ unit buildings).
- Sonoma County population projected at +8% by 2050 — modest demand growth; plan on rents tracking national, not racing it.
- 3 sale attempts since 6y ago with the ask held roughly flat each time — persistent listings suggest the price (not the market) is what's stuck; bring a comps-based counter.
- Current owner paid $1.10M; list at $1.73M implies a 57% gain — meaningful room to come down on a strong offer.
- Climate carrying-cost: moderate flood risk — expect insurance premiums to compound above CPI over the hold.
- Cap rate 7.8% vs local median 2.9% in Rohnert Park — top-decile yield for the area; either an underpriced asset or a hidden risk that comps aren't pricing in. Stress-test before assuming the spread holds.
- At $17,608/mo this rent would consume 213% of the median local household income ($99k/yr) (locally 2507% of renters already pay >50% of income on rent) — very limited rent-growth headroom before tenants either downsize or default.
Questions for listing agent
- Can we see the unit-by-unit rent roll, current vacancy, and any below-market leases? What's the average tenancy length?
- What capital expenditures (roof, boiler, parking lot, exteriors) have been made in the last 5 years, and what's planned in the next 2?
- Built in 1973 — when were the roof, HVAC, electrical panel, plumbing, and water heater last replaced?
- Is there a deadline driving the sale (1031 exchange, divorce, estate, relocation)? That informs how much negotiation room exists.
- Schools are B-rated — typically a magnet for longer-tenancy family renters. What's the average tenant stay here, and is there a school-zone premium baked into asking?
- What's the average days-on-market for RENTAL listings here right now (not sales)? A rising rental-DOM trend means longer vacancies and softer asking-rent achievability than the comps imply.
- What's the recent tenant-quality profile in this submarket — average credit score on applications, eviction rate, late-payment / NSF rate, and stable-employment percentage? A property-management company in the area should have these aggregated.
- How much new apartment / multifamily construction is in the pipeline within 1–3 miles? Heavy new supply (>2% of stock underway) typically softens rents 12–24 months out; light construction supports rent growth.
CashFlowRE · CFR-PNHK9SF842D5GW
· Data 1 day ago
cashflowre.app · 2026-05-29