 8-Plex
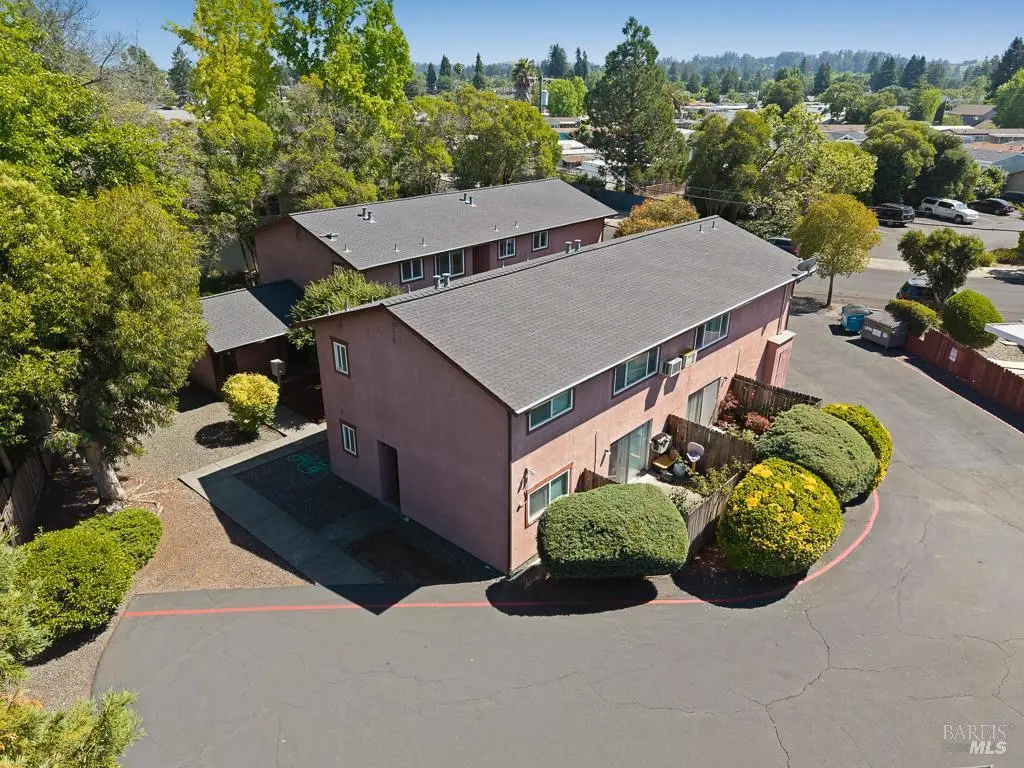
7488 Bridgit Dr · Rohnert Park, CA
Flood risk 5/10 · Moderate
- FEMA flood zone
- X (unshaded)
- Chance of flooding over 30 yrs
- 0.43%
- Est. flood insurance / yr
- $507 – $1,088
Fire risk 2/10 · Minimal
- Est. fire insurance / yr
- $659 – $1,223
Heat risk 4/10 · Minor
- Hot days now (above 91°F)
- 7 days/yr
- Hot days in 30 yrs
- 16 days/yr
Wind risk 1/10 · Minimal
- Chance of severe wind over 30 yrs
- —
Air-quality risk 8/10 · Major
- Unhealthy air days now
- 14 days/yr
- Unhealthy air days in 30 yrs
- 15 days/yr
Risk factors via First Street. Map © Google.
Why this score? — see what drove the C- grade
The composite is a weighted blend of 9 inputs, each scored 0–100. Each bar is that input's sub-score; the figure is the points it added to the 100-point composite (weight × sub-score).
- Cash flow +20.2/30.0
- ARV discount +7.5/15.0
- DSCR +6.4/10.0
- 1% rule +5.2/10.0
- Livability +3.8/5.0
- Schools +3.7/10.0
- Rent growth +3.2/5.0
- Condition / age +2.5/5.0
- Appreciation +0.0/10.0
$1,730,000
🖨 Deal sheet (PDF) 📄 Offer letter ✓ Due diligence
Multi-family units
County records classify this as Multi-Family (5+ Unit). Listing-text estimate: 8 units. confirmed
5+ unit building — per-unit beds/baths from public records are typically unavailable; the breakdown below (if shown) is an estimate from the listing text.
Listing remarks
A well-maintained Rohnert Park investment with strong and experienced management already in place. Eight units across two buildings on a large . 4-acre lot, with a highly rentable mix of five 2bd/1ba and three 1 bd/1ba. All units are currently occupied at below-market rents, leaving room to grow income over time. Recent capital improvements include a new roof and new electrical panels, making this a well-maintained asset with the heavy lifting already complete. Covered carport parking for each unit along with on-site laundry adds to tenant appeal and generates additional income. Situated just off Hwy 101 between Cotati and Rohnert Park, less than five minutes from Sonoma State University. A
Key facts
- Large lot
- New roof
- On-site laundry
Tags
Property features AI
Finance
- Financial info: 8-unit multi-family building (total units: 8)
- HOA & community: No homeowners association
Exterior
- Parking: Parking for 8 vehicles; Carport, covered parking, detached parking, and street parking available
- Utilities: Cable available and connected; Internet available; Natural gas connected; Public sewer
- Home design: Residential income property with five or more units; Two-story building
- Construction: Composition roof
- Exterior features: Enclosed patio; Regular-shaped lot
Interior
- Kitchen: Electric cook top; Free-standing refrigerator
- Bedrooms: Mix of 1- and 2-bedroom apartments (units include 1-bedroom and 2-bedroom layouts)
- Flooring: Carpet; Laminate; Other
- Bathrooms: Combination of full bathrooms across units
- Heating & cooling: Wall furnace heating; Window air conditioning units and other cooling
- Interior features: Windows with other/custom features; Enclosed patio
- Laundry & utility: Coin-operated laundry in common area; Washer/Dryer leased
Neighborhood map
What this means for you Summary
Snapshot
- This is a 8 × 2-bed/1.0-bath units multifamily listed at $1.73M.
Deal economics
- At list price, monthly cash flow is $2k ($26k/yr) — positive. Per door: $274/mo.
- The deal already cash-flows at list — no discount required.
- Meets the 1% rule at list price ($18k rent vs $1.73M).
- Recommended offer: $1.70M (1.5% below list) — sets the bar for market timing.
- Cap rate 7.8% vs local median 2.9% in Rohnert Park — top-decile yield for the area; either an underpriced asset or a hidden risk that comps aren't pricing in. Stress-test before assuming the spread holds.
Location & tenants
- Location reads 75/100 on livability (#116 in CA, #4,166 nationally) — a middle-class / working-renter tenant base. Strengths: commute A+, employment A+, health & safety A+; Watch: cost of living F.
- Cotati-Rohnert Park Unified (suburban): math 24% / reading 61% proficiency, ranked #205 of 517 in CA (top 40%) — families likely to look elsewhere, expect single-tenant / working-renter base with shorter leases.
- Zoned schools: John Reed Primary (378 students, 80% FRL); Technology Middle (math 24% / reading 24%, grade F, #277 of 498 statewide, top 73%, 426 students, 68% FRL); Rancho Cotate High (math 12% / reading 57%, grade F, #618 of 1,170 statewide, top 56%, 1,611 students, 36% FRL) — zoned schools average 61% FRL vs 36% district-wide (25 pts higher); higher-poverty schools than district average — tighter screening recommended.
- Zoned-school proficiency averages 30% at this address vs 42% district-wide (-13 pts) — the specific schools serving this property underperform the Cotati-Rohnert Park Unified average; the district grade overstates school quality for this exact location.
- Market conditions: Rents rising (+2.7%/yr); 100 active listings in the ZIP; solid renter incomes; 1,039 units permitted in Sonoma County in 2024 (185 in 5+ unit buildings).
- At $17,608/mo this rent would consume 213% of the median local household income ($99k/yr) (locally 2507% of renters already pay >50% of income on rent) — very limited rent-growth headroom before tenants either downsize or default.
Forward outlook
- Local home prices are declining (-3.0%/yr); year-one equity from $12k of loan paydown is wiped out by about $52k of value loss. Plan a longer hold.
- Sonoma County population projected at +8% by 2050 — modest demand growth; plan on rents tracking national, not racing it.
Negotiation context
- It's been on market 16 days — a 2% lower offer ($1.70M) is reasonable based on typical stale-listing flexibility.
- 3 sale attempts since 6y ago with the ask held roughly flat each time — persistent listings suggest the price (not the market) is what's stuck; bring a comps-based counter.
- Current owner paid $1.10M; list at $1.73M implies a 57% gain — meaningful room to come down on a strong offer.
Risks & watch-outs
- Climate carrying-cost: moderate flood risk — expect insurance premiums to compound above CPI over the hold.
Questions for the listing agent
- Can we see the unit-by-unit rent roll, current vacancy, and any below-market leases? What's the average tenancy length?
- What capital expenditures (roof, boiler, parking lot, exteriors) have been made in the last 5 years, and what's planned in the next 2?
- Built in 1973 — when were the roof, HVAC, electrical panel, plumbing, and water heater last replaced?
- Is there a deadline driving the sale (1031 exchange, divorce, estate, relocation)? That informs how much negotiation room exists.
- Schools are B-rated — typically a magnet for longer-tenancy family renters. What's the average tenant stay here, and is there a school-zone premium baked into asking?
- What's the average days-on-market for RENTAL listings here right now (not sales)? A rising rental-DOM trend means longer vacancies and softer asking-rent achievability than the comps imply.
- What's the recent tenant-quality profile in this submarket — average credit score on applications, eviction rate, late-payment / NSF rate, and stable-employment percentage? A property-management company in the area should have these aggregated.
- How much new apartment / multifamily construction is in the pipeline within 1–3 miles? Heavy new supply (>2% of stock underway) typically softens rents 12–24 months out; light construction supports rent growth.
Investment metrics
- 1% rule
- 1.02% ✓
- Cap rate
- 7.81%
- Cash-on-cash
- 5.43%
- DSCR
- 1.24
- GRM
- 8.2
CMA / ARV
No comps found within radius.
Projected returns pro-forma
-3.0% appreciation · 2.69% rent growth · sell at horizon
- IRR
- -8.2%
- Equity multiple
- 0.70×
- Total profit
- $-146,136
- Equity at exit
- $257,949
- IRR
- 0.9%
- Equity multiple
- 1.06×
- Total profit
- $30,606
- Equity at exit
- $149,579
Cash invested: $484,400 (down + closing). Projections, not guarantees.
Landlord ↔ Tenant lean methodology
- Overall (STATE)
- 18 Strongly Tenant-Friendly
- State California
- 18 Strongly Tenant-Friendly · D+13
- County
- — inherits STATE
- City
- — inherits STATE
ZIP-level market 94928
- Rents YoY
- 2.7%
- Active inventory
- 100
- Price-to-rent
- 65.5×
Monthly cashflow live
- Estimated rent
- $17,608 high interval (Pro) →
- Mortgage (P&I)
- −$9,072
- Tax from tax record
- −$1,926 /mo · $23,113/yr
- Insurance
- −$721
- HOA
- −$0
- Vacancy / Maint / Mgmt
- −$3,698
- Net cashflow
- $2,191
Break-even live
Sensitivity live
| Price | -10% $3,170 | -5% $2,681 | +0% $2,191 | +5% $1,701 | +10% $1,212 |
|---|---|---|---|---|---|
| Rent | -10% $800 | -5% $1,496 | +0% $2,191 | +5% $2,887 | +10% $3,582 |
| Rate | -1.0pp $3,062 | -0.5pp $2,631 | base $2,191 | +0.5pp $1,743 | +1.0pp $1,287 |
8-unit breakdown (identical units grouped — click to expand)
| Units | Beds | Baths | Est. rent |
|---|---|---|---|
| 8× units | 2 | 1 | $17,608 |
| #1 | 2 | 1 | $2,201 |
| #2 | 2 | 1 | $2,201 |
| #3 | 2 | 1 | $2,201 |
| #4 | 2 | 1 | $2,201 |
| #5 | 2 | 1 | $2,201 |
| #6 | 2 | 1 | $2,201 |
| #7 | 2 | 1 | $2,201 |
| #8 | 2 | 1 | $2,201 |
| Total (8 units) | $17,608 | ||
UW: 25.0% down · 7.5% · 30yr · 1.5% tax · 5.0% vac · 8.0% maint · 8.0% mgmt
Financing live
Cash to close
- Down payment
- $432,500
- Closing costs
- $51,900
- Reserves months
- —
- Total cash needed
- —
Loan-product check · same deal, 3 products live
Conventional
25% down · 7.5% · 30yr
- Down + closing
- —
- Monthly P&I
- —
- Monthly cashflow
- —
- DSCR
- —
- Eligible?
- —
Personal DTI + credit; lowest rate.
DSCR
20% down · 8.5% · 30yr
- Down + closing
- —
- Monthly P&I
- —
- Monthly cashflow
- —
- DSCR
- —
- Eligible?
- —
No personal income docs; deal must DSCR.
Hard money
10% down · 12.0% · 12mo
- Down + closing
- —
- Monthly P&I
- —
- Monthly cashflow
- —
- DSCR
- —
- Eligible?
- —
Short-term bridge; refi at stabilization.
Listing history 12 events
-
2026-06-21days on market $1,730,000 Active 16 DOM
-
2026-06-18days on market $1,730,000 Active 13 DOM
-
2026-06-17days on market $1,730,000 Active 12 DOM
-
2026-06-16days on market $1,730,000 Active 11 DOM
-
2026-06-15days on market $1,730,000 Active 10 DOM
-
2026-06-14days on market $1,730,000 Active 8 DOM
-
2026-06-13days on market $1,730,000 Active 7 DOM
-
2026-06-10days on market $1,730,000 Active 5 DOM
-
2026-06-09days on market $1,730,000 Active 4 DOM
-
2026-06-08days on market $1,730,000 Active 3 DOM
-
2026-06-07remarks 699-char remark
-
2026-06-07$1,730,000 Active 2 DOM
ⓘ Source: listings_history table (triggers on properties + properties_extension) + one-shot
backfill from property_details.listing_events for pre-trigger history.
Tax reassessment forecast CA · Resets to sale price
- Current annual tax
- $23,113 · $1,926/mo
- Projected year-2 tax
- $23,113 · $1,926/mo
- Expected delta
- $0/yr ($0/mo · 0.0%)
ⓘ Screening estimate from a state-policy table — verify with the county assessor before closing.
Climate risk First Street
- Flood 5/10 Major FEMA zone X (unshaded) · 43% chance over 30 yrs
- Wildfire 2/10 Low
- Heat 4/10 Moderate 7 d/yr ≥91°F today · 16 d/yr by 30 yrs out
- Wind 1/10 Low
- Air quality 8/10 Severe 14 unhealthy d/yr today · 15 by 30 yrs out
Nearby sold comps map
Loading sold comps map…
Walkable amenities ~0.75 mi
Loading nearby amenities…
Taxation est. · year 1
- Rental income
- $211,296
- − Mortgage interest
- −$96,907
- − Property taxes
- −$23,113
- − Insurance
- −$8,650
- − Repairs & maintenance
- −$16,904
- − Management
- −$16,904
- − Depreciation
- −$50,327
- Taxable loss
- −$1,508
- Est. tax savings @ 24.0%
- +$362
- After-tax cash flow
- $26,655/yr
For passive investors: Depreciation is non-cash, so a rental often shows a tax loss while cash-flowing — sheltering income. Rental losses are passive: they offset passive income freely, and up to $25,000/yr can offset ordinary (W-2) income if you actively participate and your MAGI is under $100k (phasing out to $0 by $150k); unused losses carry forward. On sale, claimed depreciation is recaptured at up to 25%, and gains may owe capital-gains tax (a 1031 exchange can defer both). Figures are a year-1 estimate at your 24.0% rate — not tax advice; consult a CPA.
Schools (NCES district)
- District
- Cotati-Rohnert Park Unified
- NCES district ID
- 0609940
- Math proficiency
- 24% ▼ -6.00%
- Reading proficiency
- 61% ▲ 15.00%
- Median HH income
- $60,499
- Composite
- 37.42/100
- National rank
- #4420
- State rank
- #205 of 517 in CA
Livability — Rohnert Park
- Score
- 75/100
- State rank
- #116
- US rank
- #4166
Category grades
Schools grade is shown separately in the Schools card above.
Census & demographics
- Census place
- Rohnert Park, CA
- County
- Sonoma County · 449,805 people
- City population
- 46,829
- Metro
- Santa Rosa-Petaluma, CA
- Population (ZIP)
- 46,829
- Household income
- $99,280
- Rent vs Own
- Severe rent burden
- 2507.0
Population outlook (Sonoma County) Hauer SSP2
- Today (2025)
- 539,935 people
- By 2030
- 554,870 · +2.8%
- By 2040
- 573,262 · +6.2%
- By 2050
- 580,715 · +7.6%
- By 2075
- 579,229 · +7.3%
- By 2100
- 547,835 · +1.5%
Race, ethnicity, and origin ACS 2023
- Neighborhood character
- Diverse neighborhood (Simpson 0.62)
- Race & ethnicity
- White 52% Hispanic / Latino 33% Two or more races 19% Asian 6% Black 3% Native American 1%
- Hispanic origin (detail)
- Mexican 25%
- Common ancestry
- Italian 5% Slovak 3% Romanian 2%
- Foreign-born
- 15% · Canada, China, Vietnam
- Languages at home
- 72% English-only · Spanish 20% Other Asian/Pacific 2% Russian/Polish/Slavic 1%
Political lean MEDSL · Sonoma
- 2024 margin
- Solid D (+46.2) · D 71.4% · R 25.2% · Other 3.3%
- 2008→2024 swing
- -3.4pp toward R · 2008: 49.6pp · 2024: 46.2pp
- All cycles
- 2024: D+46.2 2020: D+51.5 2016: D+47.9 2012: D+44.9 2008: D+49.6
Not yet ingested
- Civics
- —
Market trends
- HPI YoY
- ▼ -628.14%
- Current HPI
- 259.9121
- Rent YoY
- ▲ 2.69%
- Metro
- Santa Rosa-Petaluma, CA
- State GDP YoY
- ▲ 3.21%
- F500 in state
- 116
Industry mix (Fortune 500 HQ in CA)
| Industry | F500 HQs | Revenue |
|---|---|---|
| Technology | 27 | $1,492B |
|
||
| Financial Services | 3 | $174B |
|
||
| Retail | 3 | $44B |
|
||
| Insurance | 3 | $26B |
|
||
| Media / Entertainment | 2 | $115B |
|
||
| Pharmaceuticals / Biotech | 2 | $62B |
|
||
Price history
+264.2% since first listed8 events — show timeline
- 2026-06-05 Listed $1,730,000 BAREIS
- 2023-10-28 Listed $2,350,000 BAREIS
- 2021-01-15 Delisted — BAREIS
- 2020-12-10 Price Changed $2,350,000 BAREIS
- 2020-08-20 Price Changed $2,585,000 BAREIS
- 2020-02-19 Listed $2,650,000 BAREIS
- 2006-10-16 Sold (Public Records) $1,100,000 Public Records
- 1998-03-25 Sold (Public Records) $475,000 Public Records
Property tax history
+3.3%/yrLatest (2025): $23,113 · +2.5% YoY. Source: county tax records.
Cash-flow waterfall
monthlySold comps — $/sqft
last 12 mo · ≤1 miLoading sold comps…