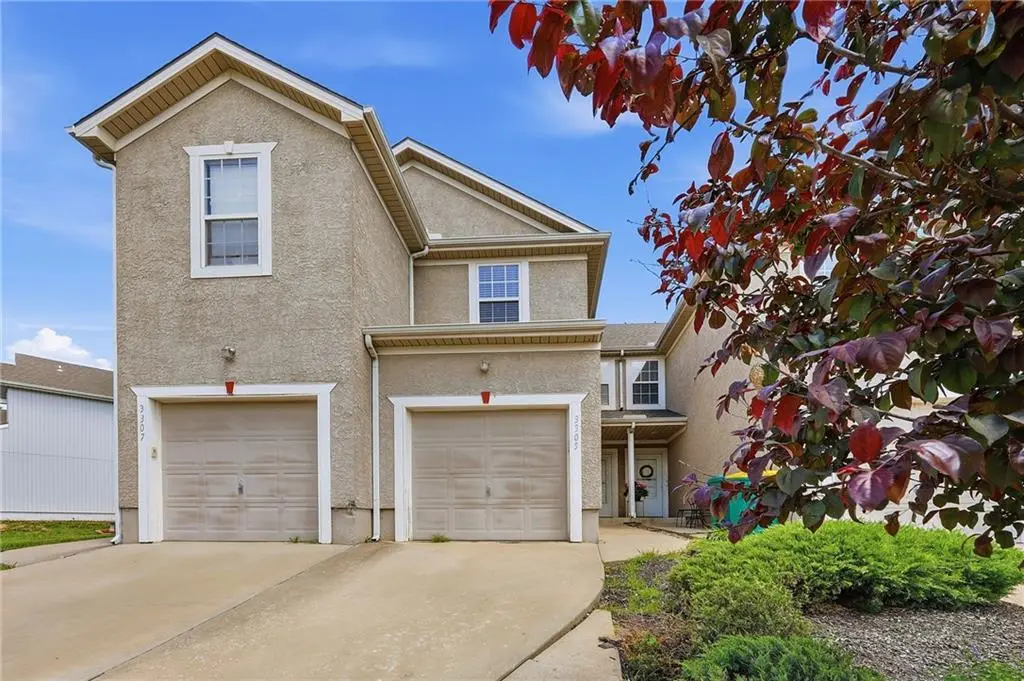
3305 N 103rd Pl
Kansas City, KS 66109
$210,000D
2 bd · 2.5 ba ·
1,280 sqft ·
Built 2006
· Townhouse
· Active
· 45 DOM
Cashflow @ list (25.0% down · 7.5%)
Estimated rent
$1,863/mo
Mortgage (P&I)
−$1,101
Tax + insurance
−$350
HOA
−$67
Vac / Maint / Mgmt
−$391
Net cashflow
$-46/mo
Annual
$-555/yr
Cap rate
6.03%
Cash-on-cash
-0.94%
DSCR
0.96
1% rule
0.89%
Cash to close
$58,800
Investor read
- This is a 2-bed/2.5-bath townhouse listed at $210k.
- At list price, monthly cash flow is $-46 ($-555/yr) — negative.
- To cash-flow at today's rent, offer at most $203k (3.2% below list).
- To meet the 1% rule (rent ≥ 1% of price), the offer needs to be $186k (11.3% below list).
- It's been on market 45 days — a 3% lower offer ($204k) is reasonable based on typical stale-listing flexibility.
- Recommended offer: $186k (11.3% below list) — sets the bar for 1% rule.
- Local home prices are declining (-3.0%/yr); year-one equity from $1k of loan paydown is wiped out by about $6k of value loss. Plan a longer hold.
- Location reads 72/100 on livability (#103 in KS) — a middle-class / working-renter tenant base. Strengths: commute A+, cost of living A+, housing A+; Watch: crime F, employment D-.
- Piper-Kansas City (rural): math 37% / reading 44% proficiency, ranked #19 of 169 in KS (top 11%) — families likely to look elsewhere, expect single-tenant / working-renter base with shorter leases; only 14% free/reduced lunch — higher-income household profile.
- Zoned schools: Piper Prairie Elementary (539 students, 28% FRL); Piper Middle (math 26% / reading 33%, grade F, #72 of 219 statewide, top 38%, 708 students, 26% FRL); Piper High (math 17% / reading 32%, grade F, #105 of 327 statewide, top 49%, 779 students, 24% FRL).
- Zoned-school proficiency averages 27% at this address vs 40% district-wide (-14 pts) — the specific schools serving this property underperform the Piper-Kansas City average; the district grade overstates school quality for this exact location.
- Market conditions: Rents soft (-1.8%/yr); 239 active listings in the ZIP; 11 comparable units currently listed for rent nearby; rentals at typical pace (median 26d on market — plan ~3-4 weeks tenant-placement turnaround); solid renter incomes; 369 units permitted in Wyandotte County in 2024 (236 in 5+ unit buildings).
- Wyandotte County population projected at +17% by 2050 — long-run rental-demand tailwind backs the buy-and-hold thesis.
- 4 sale attempts since 20y ago with the ask held roughly flat each time — persistent listings suggest the price (not the market) is what's stuck; bring a comps-based counter.
- Cap rate 6.0% vs local median 4.8% in Kansas City — meaningfully above typical; check what's discounted (condition, days-on-market, listing class) to confirm the premium yield is real.
Questions for listing agent
- What do current leases actually rent for vs. the listed asking? Can we see a recent rent roll and the last 12 months of T-12 income?
- It's been on market 45 days. Have you received any prior offers? Is the seller open to a 11% concession, seller financing, or rate buy-down credit?
- What does the HOA fee cover, when was the last increase, and are there any pending special assessments or reserve-fund shortfalls?
- Is there a deadline driving the sale (1031 exchange, divorce, estate, relocation)? That informs how much negotiation room exists.
- Schools are F-rated, which usually means shorter tenancies and higher turnover. Who's the typical renter profile here, and what's been the actual vacancy rate?
- Crime grade is F in this area — have there been break-ins, vandalism, or insurance claims at this property in the last 3 years? What carrier currently insures it and at what premium?
- The area grade is low — what's the realistic commute time and amenity access for the typical tenant pool here? Any planned neighborhood developments (good or bad) we should know about?
- What's the average days-on-market for RENTAL listings here right now (not sales)? A rising rental-DOM trend means longer vacancies and softer asking-rent achievability than the comps imply.
CashFlowRE · CFR-PNYNPNA3YZHEQV
· Data 1 day ago
cashflowre.app · 2026-05-29