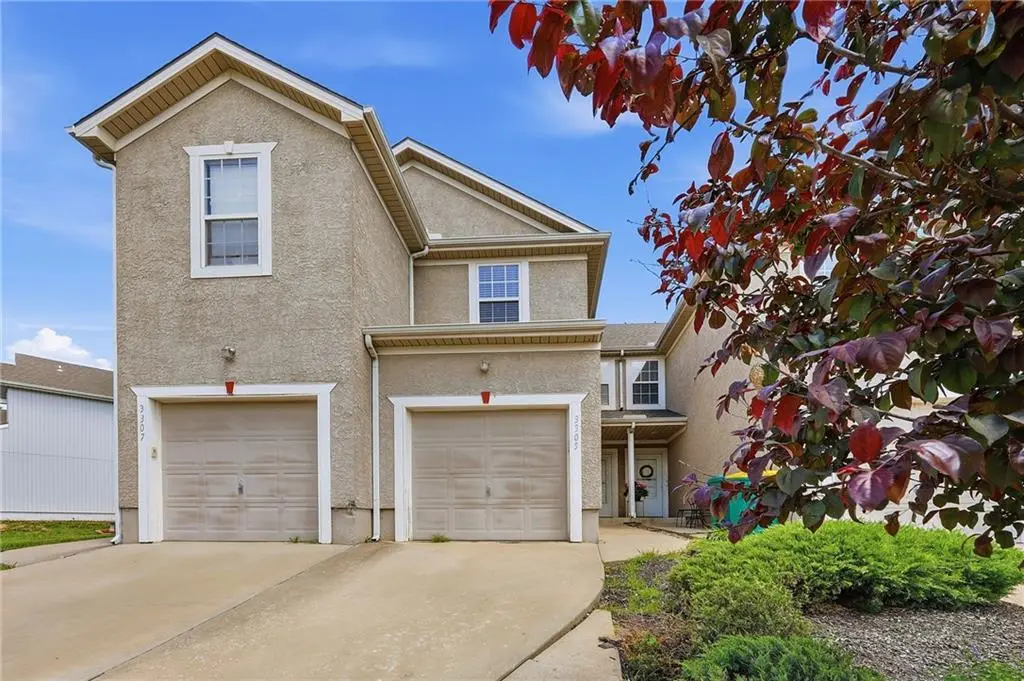
3305 N 103rd Pl · Kansas City, KS
Flood risk 1/10 · Minimal
- FEMA flood zone
- X (unshaded)
- Chance of flooding over 30 yrs
- 0.0%
- Est. flood insurance / yr
- $507 – $1,088
Fire risk 4/10 · Minor
- Est. fire insurance / yr
- $1,154 – $2,142
Heat risk 4/10 · Minor
- Hot days now (above 108°F)
- 7 days/yr
- Hot days in 30 yrs
- 17 days/yr
Wind risk 2/10 · Minimal
- Chance of severe wind over 30 yrs
- —
Air-quality risk 2/10 · Minimal
- Unhealthy air days now
- 1 days/yr
- Unhealthy air days in 30 yrs
- 2 days/yr
Risk factors via First Street. Map © Google.
Why this score? — see what drove the D grade
The composite is a weighted blend of 9 inputs, each scored 0–100. Each bar is that input's sub-score; the figure is the points it added to the 100-point composite (weight × sub-score).
- Cash flow +12.1/30.0
- ARV discount +10.8/15.0
- 1% rule +3.9/10.0
- Schools +3.9/10.0
- DSCR +3.6/10.0
- Livability +3.6/5.0
- Condition / age +2.5/5.0
- Rent growth +2.1/5.0
- Appreciation +0.0/10.0
$210,000
🖨 Deal sheet (PDF) 📄 Offer letter ✓ Due diligence
Listing remarks
Freshly painted and move-in ready, this Crystal Ridge townhome offers a clean, updated interior with a layout designed for easy, low-maintenance living. The main level provides comfortable, connected living and dining spaces that flow naturally into the kitchen, creating a practical setup for both daily routines and entertaining. Upstairs, the spacious primary suite features a walk-in closet and private bath, while the second bedroom includes its own en suite. A second-floor laundry room adds everyday convenience right where it’s needed. An attached garage and easy highway access simplify the daily commute, while the location places you just minutes from Legends Outlets Kansas City, K
Key facts
- $67 HOA
- Garage
- Built 2006
Property features AI
Finance
- HOA & community: Part of Crystal Ridge Residential Homes Association; Annual HOA fee (approximately $800) covering snow removal; Community clubhouse
Exterior
- Parking: Attached garage facing front (1-car garage)
- Utilities: Public water; Public sewer; High-speed internet available
- Home design: Attached townhouse; 2 stories; Estimated above-grade finished area
- Construction: Board & batten siding; Composition roof; Slab foundation; Built approximately 16–20 years ago
- Exterior features: Patio
Interior
- Kitchen: Dishwasher; Disposal; Free-standing electric oven; Refrigerator
- Bedrooms: 2 bedrooms (both located on the second level)
- Flooring: Carpet in living areas and bedrooms; Vinyl in kitchen
- Bathrooms: 2 full bathrooms; 1 half bathroom
- Heating & cooling: Electric heating; Heat pump; Electric cooling (has central cooling)
- Interior features: Walk-in closet(s); Kit/Dining combination
- Laundry & utility: Washer and Dryer; Laundry located on bedroom level
Neighborhood map
What this means for you Summary
Snapshot
- This is a 2-bed/2.5-bath townhouse listed at $210k.
Deal economics
- At list price, monthly cash flow is $-46 ($-555/yr) — negative.
- To cash-flow at today's rent, offer at most $203k (3.2% below list).
- To meet the 1% rule (rent ≥ 1% of price), the offer needs to be $186k (11.3% below list).
- Recommended offer: $186k (11.3% below list) — sets the bar for 1% rule.
- Cap rate 6.0% vs local median 4.8% in Kansas City — meaningfully above typical; check what's discounted (condition, days-on-market, listing class) to confirm the premium yield is real.
Location & tenants
- Location reads 72/100 on livability (#103 in KS) — a middle-class / working-renter tenant base. Strengths: commute A+, cost of living A+, housing A+; Watch: crime F, employment D-.
- Piper-Kansas City (rural): math 37% / reading 44% proficiency, ranked #19 of 169 in KS (top 11%) — families likely to look elsewhere, expect single-tenant / working-renter base with shorter leases; only 14% free/reduced lunch — higher-income household profile.
- Zoned schools: Piper Prairie Elementary (539 students, 28% FRL); Piper Middle (math 26% / reading 33%, grade F, #72 of 219 statewide, top 38%, 708 students, 26% FRL); Piper High (math 17% / reading 32%, grade F, #105 of 327 statewide, top 49%, 779 students, 24% FRL).
- Zoned-school proficiency averages 27% at this address vs 40% district-wide (-14 pts) — the specific schools serving this property underperform the Piper-Kansas City average; the district grade overstates school quality for this exact location.
- Market conditions: Rents soft (-1.8%/yr); 239 active listings in the ZIP; 11 comparable units currently listed for rent nearby; rentals at typical pace (median 25d on market — plan ~3-4 weeks tenant-placement turnaround); solid renter incomes; 369 units permitted in Wyandotte County in 2024 (236 in 5+ unit buildings).
Forward outlook
- Local home prices are declining (-3.0%/yr); year-one equity from $1k of loan paydown is wiped out by about $6k of value loss. Plan a longer hold.
- Wyandotte County population projected at +17% by 2050 — long-run rental-demand tailwind backs the buy-and-hold thesis.
Negotiation context
- It's been on market 45 days — a 3% lower offer ($204k) is reasonable based on typical stale-listing flexibility.
- 4 sale attempts since 20y ago with the ask held roughly flat each time — persistent listings suggest the price (not the market) is what's stuck; bring a comps-based counter.
Questions for the listing agent
- What do current leases actually rent for vs. the listed asking? Can we see a recent rent roll and the last 12 months of T-12 income?
- It's been on market 45 days. Have you received any prior offers? Is the seller open to a 11% concession, seller financing, or rate buy-down credit?
- What does the HOA fee cover, when was the last increase, and are there any pending special assessments or reserve-fund shortfalls?
- Is there a deadline driving the sale (1031 exchange, divorce, estate, relocation)? That informs how much negotiation room exists.
- Schools are F-rated, which usually means shorter tenancies and higher turnover. Who's the typical renter profile here, and what's been the actual vacancy rate?
- Crime grade is F in this area — have there been break-ins, vandalism, or insurance claims at this property in the last 3 years? What carrier currently insures it and at what premium?
- The area grade is low — what's the realistic commute time and amenity access for the typical tenant pool here? Any planned neighborhood developments (good or bad) we should know about?
- What's the average days-on-market for RENTAL listings here right now (not sales)? A rising rental-DOM trend means longer vacancies and softer asking-rent achievability than the comps imply.
- What's the recent tenant-quality profile in this submarket — average credit score on applications, eviction rate, late-payment / NSF rate, and stable-employment percentage? A property-management company in the area should have these aggregated.
- How much new for-sale + rental construction is in the pipeline within 1–3 miles? Heavy new supply typically softens prices + rents 12–24 months out; constrained supply supports both.
Investment metrics
- 1% rule
- 0.89% ✗
- Cap rate
- 6.03%
- Cash-on-cash
- -0.94%
- DSCR
- 0.96
- GRM
- 9.4
CMA / ARV
- ARV (on-the-fly)
- $226,560
- Comps found
- 4
Show comp detail 4 sales within ~0.75 mi
| Address | Dist | Beds/Ba | Sqft | Sold | Price | $/sf | Match |
|---|---|---|---|---|---|---|---|
| 10331 Sloan Ave | 0.05mi | 2/2.0 | 1,240 (-3%) | 1mo | $220,000 | $177 | 90 |
| 10349 Sloan Ave | 0.03mi | 3/2.5 (+1) | 1,388 (+8%) | 8mo | $217,000 | $156 | 73 |
| 3301 N 103rd Ter | 0.11mi | 2/2.0 | 1,100 (-14%) | 0mo | $234,950 | $214 | 69 |
| 10329 Parkview Ave | 0.13mi | 3/2.0 (+1) | 1,370 (+7%) | 19mo | $210,000 | $153 | 60 |
Match score weights: distance 35% · size 25% · config 20% · recency 20%. Top-matched comps best support the ARV.
Projected returns pro-forma
-3.0% appreciation · 0.0% rent growth · sell at horizon
- IRR
- -21.4%
- Equity multiple
- 0.28×
- Total profit
- $-42,368
- Equity at exit
- $31,312
- IRR
- -24.9%
- Equity multiple
- -0.05×
- Total profit
- $-61,511
- Equity at exit
- $18,157
Cash invested: $58,800 (down + closing). Projections, not guarantees.
Landlord ↔ Tenant lean methodology
- Overall (STATE)
- 83 Strongly Landlord-Friendly
- State Kansas
- 83 Strongly Landlord-Friendly · R+10
- County
- — inherits STATE
- City
- — inherits STATE
ZIP-level market 66109
- Rents YoY
- -1.8%
- Active inventory
- 239
- Price-to-rent
- 9.4×
Monthly cashflow live
- Estimated rent
- $1,863 high interval (Pro) →
- Mortgage (P&I)
- −$1,101
- Tax est. 1.5%
- −$262 /mo · $3,150/yr
- Insurance
- −$88
- HOA
- −$67
- Vacancy / Maint / Mgmt
- −$391
- Net cashflow
- $-46
Break-even live
Sensitivity live
| Price | -10% $99 | -5% $26 | +0% $-46 | +5% $-119 | +10% $-191 |
|---|---|---|---|---|---|
| Rent | -10% $-193 | -5% $-120 | +0% $-46 | +5% $27 | +10% $101 |
| Rate | -1.0pp $59 | -0.5pp $7 | base $-46 | +0.5pp $-101 | +1.0pp $-156 |
UW: 25.0% down · 7.5% · 30yr · 1.5% tax · 5.0% vac · 8.0% maint · 8.0% mgmt
Financing live
Cash to close
- Down payment
- $52,500
- Closing costs
- $6,300
- Reserves months
- —
- Total cash needed
- —
Loan-product check · same deal, 3 products live
Conventional
25% down · 7.5% · 30yr
- Down + closing
- —
- Monthly P&I
- —
- Monthly cashflow
- —
- DSCR
- —
- Eligible?
- —
Personal DTI + credit; lowest rate.
DSCR
20% down · 8.5% · 30yr
- Down + closing
- —
- Monthly P&I
- —
- Monthly cashflow
- —
- DSCR
- —
- Eligible?
- —
No personal income docs; deal must DSCR.
Hard money
10% down · 12.0% · 12mo
- Down + closing
- —
- Monthly P&I
- —
- Monthly cashflow
- —
- DSCR
- —
- Eligible?
- —
Short-term bridge; refi at stabilization.
Rent comps 11 comps
| Address | Beds | Baths | Sqft | Rent | $/sqft | DOM | Units | Dist |
|---|---|---|---|---|---|---|---|---|
| 3253 N 103rd Pl Kansas City, KS | 3.0 | 2.5 | 1494 | $1,925 | $1.29 | 25d | 1 | 0.03mi |
| 3247 N 103rd Pl Kansas City, KS | 3.0 | 2.5 | 1494 | $1,975 | $1.32 | 25d | 1 | 0.03mi |
| 3245 N 103rd Pl Kansas City, KS | 3.0 | 2.5 | 1494 | $1,925 | $1.29 | 25d | 1 | 0.04mi |
| 3243 N 103rd Pl Kansas City, KS | 3.0 | 2.5 | 1494 | $1,925 | $1.29 | 25d | 1 | 0.04mi |
| 3241 N 103rd Pl Kansas City, KS | 3.0 | 2.5 | 1494 | $1,925 | $1.29 | 25d | 1 | 0.05mi |
| 3221 N 103rd Pl Kansas City, KS | 3.0 | 2.5 | 1494 | $1,995 | $1.34 | 23d | 1 | 0.08mi |
| 3219 N 103rd Pl Kansas City, KS | 3.0 | 2.5 | 1494 | $1,995 | $1.34 | 23d | 1 | 0.09mi |
| 10332 Farrow Ave Kansas City, KS | 3.0 | 2.5 | 1494 | $1,925 | $1.29 | 25d | 1 | 0.14mi |
| 10330 Farrow Ave Kansas City, KS | 3.0 | 2.5 | 1494 | $1,925 | $1.29 | 25d | 1 | 0.14mi |
| 10328 Farrow Ave Kansas City, KS | 3.0 | 2.5 | 1494 | $1,975 | $1.32 | 25d | 1 | 0.15mi |
| 10725 Cleveland Ave Kansas City, KS | 3.0 | 2.5 | 1498 | $2,200 | $1.47 | 16d | 1 | 1.12mi |
HOA detail
- Monthly dues
- $67 · $804/yr
Listing history 20 events
-
2026-06-21days on market $210,000 Active 45 DOM
-
2026-06-18days on market $210,000 Active 42 DOM
-
2026-06-17days on market $210,000 Active 41 DOM
-
2026-06-16days on market $210,000 Active 40 DOM
-
2026-06-15days on market $210,000 Active 39 DOM
-
2026-06-13days on market $210,000 Active 37 DOM
-
2026-06-09days on market $210,000 Active 33 DOM
-
2026-06-08days on market $210,000 Active 32 DOM
-
2026-06-07days on market $210,000 Active 31 DOM
-
2026-06-03days on market $210,000 Active 27 DOM
-
2026-06-02days on market $210,000 Active 26 DOM
-
2026-06-01days on market $210,000 Active 25 DOM
-
2026-05-31days on market $210,000 Active 24 DOM
-
2026-05-08$210,000 Active
-
2026-05-01historical $210,000
-
2014-10-13historical
-
2014-05-28$65,000
-
2009-03-29historical
-
2008-04-15$109,950
-
2006-05-04$109,950
ⓘ Source: listings_history table (triggers on properties + properties_extension) + one-shot
backfill from property_details.listing_events for pre-trigger history.
Climate risk First Street
- Flood 1/10 Low FEMA zone X (unshaded) · 0% chance over 30 yrs
- Wildfire 4/10 Moderate
- Heat 4/10 Moderate 7 d/yr ≥108°F today · 17 d/yr by 30 yrs out
- Wind 2/10 Low
- Air quality 2/10 Low 1 unhealthy d/yr today · 2 by 30 yrs out
Nearby sold comps map
Loading sold comps map…
Walkable amenities ~0.75 mi
Loading nearby amenities…
Taxation est. · year 1
- Rental income
- $22,359
- − Mortgage interest
- −$11,763
- − Property taxes
- −$3,150
- − Insurance
- −$1,050
- − Repairs & maintenance
- −$1,789
- − Management
- −$1,789
- − HOA
- −$804
- − Depreciation
- −$6,109
- Taxable loss
- −$4,095
- Est. tax savings @ 24.0%
- +$983
- After-tax cash flow
- $427/yr
For passive investors: Depreciation is non-cash, so a rental often shows a tax loss while cash-flowing — sheltering income. Rental losses are passive: they offset passive income freely, and up to $25,000/yr can offset ordinary (W-2) income if you actively participate and your MAGI is under $100k (phasing out to $0 by $150k); unused losses carry forward. On sale, claimed depreciation is recaptured at up to 25%, and gains may owe capital-gains tax (a 1031 exchange can defer both). Figures are a year-1 estimate at your 24.0% rate — not tax advice; consult a CPA.
Schools (NCES district)
- District
- Piper-Kansas City
- NCES district ID
- 2010680
- Math proficiency
- 37% ▼ -9.00%
- Reading proficiency
- 44% ▼ -3.00%
- Median HH income
- $91,126
- Composite
- 38.82/100
- National rank
- #4111
- State rank
- #19 of 169 in KS
Livability — Kansas City
- Score
- 72/100
- State rank
- #103
- US rank
- #6054
Category grades
Schools grade is shown separately in the Schools card above.
Census & demographics
- Census place
- Kansas City, KS
- County
- Wyandotte County · 130,206 people
- City population
- 130,206
- Metro
- Kansas City, MO-KS
- Population (ZIP)
- 28,355
- Household income
- $102,593
- Rent vs Own
- Severe rent burden
- 285.0
Population outlook (Wyandotte County) Hauer SSP2
- Today (2025)
- 177,063 people
- By 2030
- 183,212 · +3.5%
- By 2040
- 195,697 · +10.5%
- By 2050
- 207,897 · +17.4%
- By 2075
- 236,169 · +33.4%
- By 2100
- 255,790 · +44.5%
Race, ethnicity, and origin ACS 2023
- Neighborhood character
- Diverse neighborhood (Simpson 0.64)
- Race & ethnicity
- White 55% Black 18% Hispanic / Latino 13% Two or more races 13% Asian 7%
- Hispanic origin (detail)
- Mexican 11%
- Common ancestry
- Italian 2% Lithuanian 2% Romanian 2%
- Foreign-born
- 9% · Canada, Philippines, China
- Languages at home
- 88% English-only · Spanish 5% Other Asian/Pacific 5% Vietnamese 1%
Political lean MEDSL · Wyandotte
- 2024 margin
- Strong D (+23.9) · D 61.1% · R 37.3% · Other 1.6%
- 2008→2024 swing
- -17.0pp toward R · 2008: 40.9pp · 2024: 23.9pp
- All cycles
- 2024: D+23.9 2020: D+30.9 2016: D+29.1 2012: D+36.4 2008: D+40.9
Not yet ingested
- Civics
- —
Market trends
- HPI YoY
- ▼ -242.32%
- Current HPI
- 182.7335
- Rent YoY
- ▼ -1.79%
- Metro
- Kansas City, MO-KS
- State GDP YoY
- —
- F500 in state
- 0
Price history
+91.0% since first listed7 events — show timeline
- 2026-05-08 Listed $210,000 Heartland MLS as Distributed by MLS Grid
- 2026-05-01 Coming Soon $210,000 Heartland MLS as Distributed by MLS Grid
- 2014-10-13 Listing Removed — Heartland MLS as Distributed by MLS Grid
- 2014-05-28 Listed $65,000 Heartland MLS as Distributed by MLS Grid
- 2009-03-29 Listing Removed — Heartland MLS as Distributed by MLS Grid
- 2008-04-15 Listed $109,950 Heartland MLS as Distributed by MLS Grid
- 2006-05-04 Listed $109,950 Heartland MLS as Distributed by MLS Grid
Cash-flow waterfall
monthlySold comps — $/sqft
last 12 mo · ≤1 miLoading sold comps…