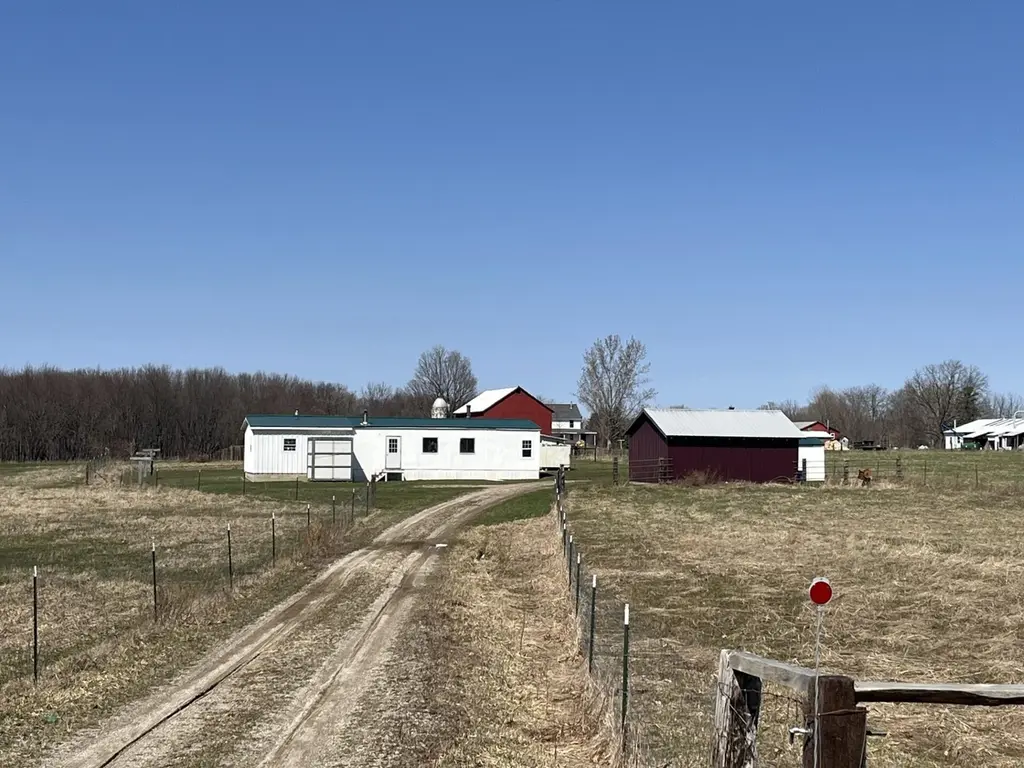
12111 W Coral Rd
Maple Valley, MI 49322
$140,000C-
1 bd · None ba ·
1,300 sqft ·
Built —
· SingleFamily
· Active
· 74 DOM
Cashflow @ list (25.0% down · 7.5%)
Estimated rent
$1,136/mo
Mortgage (P&I)
−$734
Tax + insurance
−$233
HOA
−$0
Vac / Maint / Mgmt
−$239
Net cashflow
$-70/mo
Annual
$-841/yr
Cap rate
5.69%
Cash-on-cash
-2.14%
DSCR
0.90
1% rule
0.81%
Cash to close
$39,200
Investor read
- This is a 1-bed/?-bath single-family listed at $140k.
- At list price, monthly cash flow is $-70 ($-841/yr) — negative.
- To cash-flow at today's rent, offer at most $130k (7.2% below list).
- To meet the 1% rule (rent ≥ 1% of price), the offer needs to be $114k (18.9% below list).
- It's been on market 74 days — a 6% lower offer ($132k) is reasonable based on typical stale-listing flexibility.
- Recommended offer: $114k (18.9% below list) — sets the bar for 1% rule.
- In year one you build about $15k of equity ($968 loan paydown + $14k appreciation (10.0% local appreciation)).
- Location reads: area grade C — affects rentability + tenant quality, not the cash-flow math above.
- Lakeview Community Schools (Montcalm) (rural): math 28% / reading 44% proficiency, ranked #281 of 540 in MI (top 52%) — families likely to look elsewhere, expect single-tenant / working-renter base with shorter leases.
- Zoned schools: Lakeview Elementary School (math 54% / reading 64%, grade B-, #200 of 1,397 statewide, top 16%, 326 students, 70% FRL); Lakeview Middle School (math 24% / reading 39%, grade F, #323 of 493 statewide, top 66%, 338 students, 66% FRL); Lakeview High School (math 27% / reading 47%, grade F, #334 of 713 statewide, top 51%, 366 students, 53% FRL) — zoned schools average 63% FRL vs 45% district-wide (18 pts higher); higher-poverty schools than district average — tighter screening recommended.
- Market conditions: 8 active listings in the ZIP; 273 units permitted in Montcalm County in 2024 (5 in 5+ unit buildings).
- Montcalm County population projected at -17% by 2050 — secular population decline; favor cash flow + early exit over multi-decade hold.
- 3 sale attempts with the ask held roughly flat each time — persistent listings suggest the price (not the market) is what's stuck; bring a comps-based counter.
- At projected returns (10.0% appreciation + 3.0% rent growth), your $39k cash investment doubles in ~3 years — after that, you're playing with house money.
- By year 3, paydown + projected appreciation supports a ~$38k cash-out refi (75% LTV) — recoverable capital for the next deal without selling this one.
Questions for listing agent
- What do current leases actually rent for vs. the listed asking? Can we see a recent rent roll and the last 12 months of T-12 income?
- It's been on market 74 days. Have you received any prior offers? Is the seller open to a 19% concession, seller financing, or rate buy-down credit?
- Why hasn't it sold? Are there any deal-killer items the seller is aware of (foundation, flood, title, zoning, code violations)?
- Is there a deadline driving the sale (1031 exchange, divorce, estate, relocation)? That informs how much negotiation room exists.
- What's the average days-on-market for RENTAL listings here right now (not sales)? A rising rental-DOM trend means longer vacancies and softer asking-rent achievability than the comps imply.
- What's the recent tenant-quality profile in this submarket — average credit score on applications, eviction rate, late-payment / NSF rate, and stable-employment percentage? A property-management company in the area should have these aggregated.
- How much new for-sale + rental construction is in the pipeline within 1–3 miles? Heavy new supply typically softens prices + rents 12–24 months out; constrained supply supports both.
CashFlowRE · CFR-PP440FBYT9M47M
· Data 14 h ago
cashflowre.app · 2026-05-29