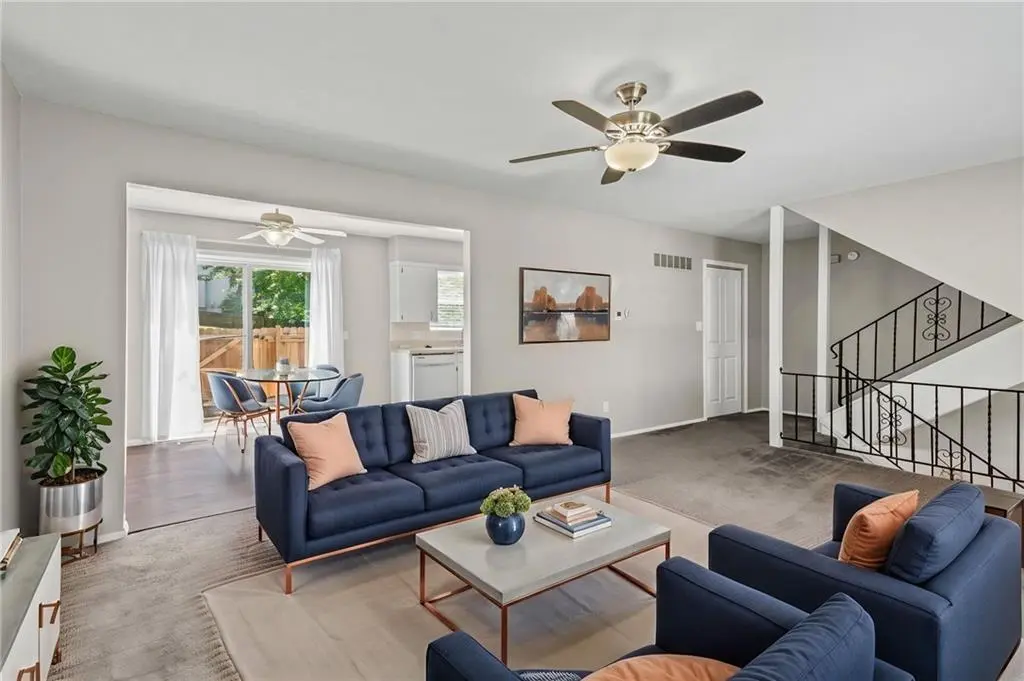
3723 NE Colonial Dr
Lee's Summit, MO 64064
$210,000D+
3 bd · 1.5 ba ·
1,296 sqft ·
Built 1969
· Townhouse
· Pending
· 3 DOM
Cashflow @ list (25.0% down · 7.5%)
Estimated rent
$1,688/mo
Mortgage (P&I)
−$1,101
Tax + insurance
−$200
HOA
−$51
Vac / Maint / Mgmt
−$354
Net cashflow
$-19/mo
Annual
$-231/yr
Cap rate
6.18%
Cash-on-cash
-0.39%
DSCR
0.98
1% rule
0.80%
Cash to close
$58,800
Investor read
- This is a 3-bed/1.5-bath townhouse listed at $210k.
- At list price, monthly cash flow is $-19 ($-231/yr) — negative.
- To cash-flow at today's rent, offer at most $207k (1.6% below list).
- To meet the 1% rule (rent ≥ 1% of price), the offer needs to be $169k (19.6% below list).
- Only 3 days on market — expect competitive offers; lowballing is unlikely to land.
- Recommended offer: $169k (19.6% below list) — sets the bar for 1% rule.
- Local home prices are declining (-3.0%/yr); year-one equity from $1k of loan paydown is wiped out by about $6k of value loss. Plan a longer hold.
- Location reads: area grade D — affects rentability + tenant quality, not the cash-flow math above.
- Blue Springs R-IV (suburban): math 55% / reading 60% proficiency, ranked #17 of 324 in MO (top 5%) — acceptable for families but not a draw, mixed tenant base, ~2y average lease.
- Zoned schools: Chapel Lakes Elem. (math 74% / reading 71%, grade A, #19 of 1,115 statewide, top 2%, 602 students, 14% FRL); Blue Springs South High (math 43% / reading 72%, grade C, #49 of 521 statewide, top 9%, 2,261 students, 22% FRL).
- Market conditions: Rents rising fast (+5.1%/yr); 231 active listings in the ZIP; 7 comparable units currently listed for rent nearby; rentals leasing fast (median 5d on market — plan ~1-2 weeks tenant-placement turnaround); high-income renter base; 4,002 units permitted in Jackson County in 2024 (2,271 in 5+ unit buildings).
- Jackson County population projected at +4% by 2050 — modest demand growth; plan on rents tracking national, not racing it.
- 2 sale attempts since 16y ago with the ask held roughly flat each time — persistent listings suggest the price (not the market) is what's stuck; bring a comps-based counter.
- Cap rate 6.2% vs local median 2.6% in Lee's Summit — top-decile yield for the area; either an underpriced asset or a hidden risk that comps aren't pricing in. Stress-test before assuming the spread holds.
- This rent is only 17% of the median local income ($118k/yr) — well below the 30% rent-burden line; pricing power to push rent on renewal without tenant pushback.
Questions for listing agent
- What do current leases actually rent for vs. the listed asking? Can we see a recent rent roll and the last 12 months of T-12 income?
- Built in 1969 — when were the roof, HVAC, electrical panel, plumbing, and water heater last replaced?
- What does the HOA fee cover, when was the last increase, and are there any pending special assessments or reserve-fund shortfalls?
- Is there a deadline driving the sale (1031 exchange, divorce, estate, relocation)? That informs how much negotiation room exists.
- The area grade is low — what's the realistic commute time and amenity access for the typical tenant pool here? Any planned neighborhood developments (good or bad) we should know about?
- What's the average days-on-market for RENTAL listings here right now (not sales)? A rising rental-DOM trend means longer vacancies and softer asking-rent achievability than the comps imply.
- What's the recent tenant-quality profile in this submarket — average credit score on applications, eviction rate, late-payment / NSF rate, and stable-employment percentage? A property-management company in the area should have these aggregated.
- How much new for-sale + rental construction is in the pipeline within 1–3 miles? Heavy new supply typically softens prices + rents 12–24 months out; constrained supply supports both.
CashFlowRE · CFR-PPBTSQAYJFEP8T
· Data 3 weeks ago
cashflowre.app · 2026-05-29