3723 NE Colonial Dr · Lee's Summit, MO
Flood risk 1/10 · Minimal
- FEMA flood zone
- X (unshaded)
- Chance of flooding over 30 yrs
- 0.0%
- Est. flood insurance / yr
- $473 – $860
Fire risk 1/10 · Minimal
- Est. fire insurance / yr
- $1,054 – $1,958
Heat risk 4/10 · Minor
- Hot days now (above 106°F)
- 7 days/yr
- Hot days in 30 yrs
- 16 days/yr
Wind risk 2/10 · Minimal
- Chance of severe wind over 30 yrs
- —
Air-quality risk 3/10 · Minor
- Unhealthy air days now
- 3 days/yr
- Unhealthy air days in 30 yrs
- 3 days/yr
Risk factors via First Street. Map © Google.
Why this score? — see what drove the D+ grade
The composite is a weighted blend of 9 inputs, each scored 0–100. Each bar is that input's sub-score; the figure is the points it added to the 100-point composite (weight × sub-score).
- ARV discount +15.0/15.0
- Cash flow +12.8/30.0
- Schools +5.1/10.0
- DSCR +3.8/10.0
- Rent growth +3.8/5.0
- 1% rule +3.0/10.0
- Livability +2.5/5.0
- Condition / age +2.5/5.0
- Appreciation +0.0/10.0
$210,000
🖨 Deal sheet 📄 Offer letter ✓ Due diligence
Listing remarks MLS
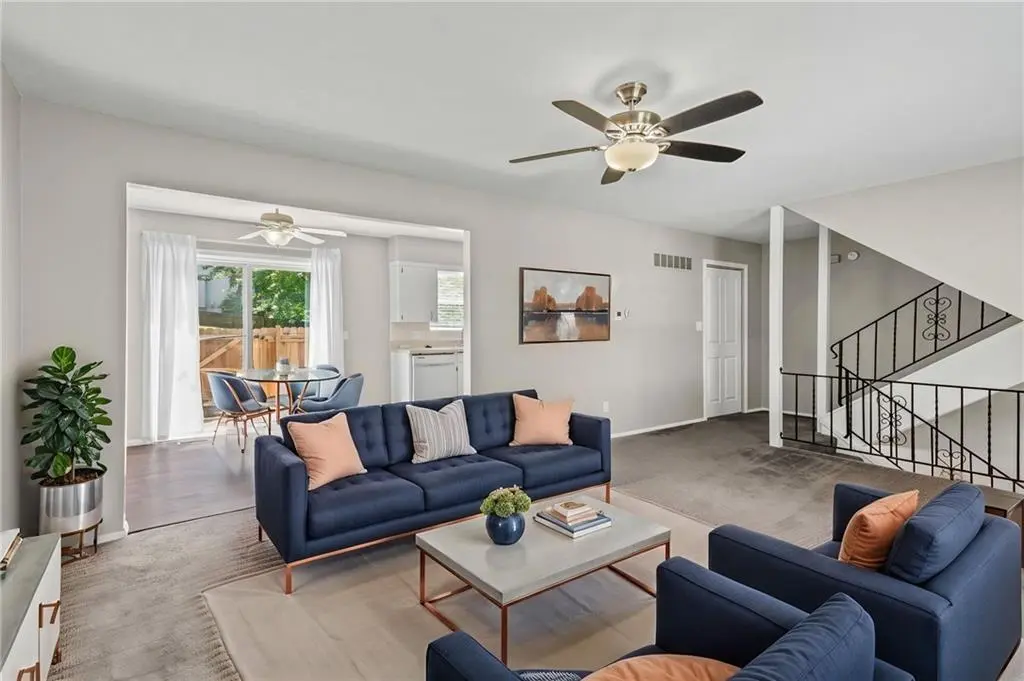
RARE FIND- 3 BR townhome w/ 2 car garage in Lee's Summit/Blue Springs area for under $75k! 2 sty layout features Fam rm, Kit w/ eat-in area & 1/2 BA on main level. 3 BRs & full bathroom upstairs- Master BR has his & hers closets. Privacy fence around patio, lower level utility rm. Maint provided. LS address, Blue Springs schools- great location!
Key facts
- $51 HOA
- 2 garage spots
- Community pool
Property features AI
Finance
- Other: Maintenance provided (lawn and snow removal)
- HOA & community: Homeowners association with monthly fee; HOA amenities include pool and trails; HOA fee covers curbside recycling, lawn service, snow removal, and trash (monthly fee)
Exterior
- Parking: Attached garage with garage door opener (garage faces front); 2-car garage
- Utilities: Public water; Public sewer; Cable available; High-speed internet available
- Home design: Residential townhouse; Attached property; 2-story layout; Above-grade finished area reported
- Construction: Brick/mortar construction; Composition roof; Concrete basement
- Exterior features: Patio; Privacy fencing; Zero lot line
Interior
- Kitchen: Dishwasher; Electric range; Exhaust fan; Eat-in kitchen / kitchen-dining combo; Built-in features; Ceiling fan in kitchen
- Bedrooms: 3 bedrooms (all on the second level)
- Flooring: Carpet
- Bathrooms: 1 full bathroom; 1 half bathroom
- Heating & cooling: Forced-air heating; Electric cooling (central air)
- Interior features: Ceiling fans; Storm windows; Storm doors
- Laundry & utility: Laundry room in basement; Basement laundry
Neighborhood map
What this means for you Summary
Snapshot
- This is a 3-bed/1.5-bath townhouse listed at $210k.
Deal economics
- At list price, monthly cash flow is $-19 ($-231/yr) — negative.
- To cash-flow at today's rent, offer at most $207k (1.6% below list).
- To meet the 1% rule (rent ≥ 1% of price), the offer needs to be $169k (19.6% below list).
- Recommended offer: $169k (19.6% below list) — sets the bar for 1% rule.
- Cap rate 6.2% vs local median 2.6% in Lee's Summit — top-decile yield for the area; either an underpriced asset or a hidden risk that comps aren't pricing in. Stress-test before assuming the spread holds.
Location & tenants
- Location reads: area grade D — affects rentability + tenant quality, not the cash-flow math above.
- Blue Springs R-IV (suburban): math 55% / reading 60% proficiency, ranked #17 of 324 in MO (top 5%) — acceptable for families but not a draw, mixed tenant base, ~2y average lease.
- Zoned schools: Chapel Lakes Elem. (math 74% / reading 71%, grade A, #19 of 1,115 statewide, top 2%, 602 students, 14% FRL); Blue Springs South High (math 43% / reading 72%, grade C, #49 of 521 statewide, top 9%, 2,261 students, 22% FRL).
- Market conditions: Rents rising fast (+5.1%/yr); 231 active listings in the ZIP; 7 comparable units currently listed for rent nearby; rentals leasing fast (median 4d on market — plan ~1-2 weeks tenant-placement turnaround); high-income renter base; 4,002 units permitted in Jackson County in 2024 (2,271 in 5+ unit buildings).
- This rent is only 17% of the median local income ($118k/yr) — well below the 30% rent-burden line; pricing power to push rent on renewal without tenant pushback.
Forward outlook
- Local home prices are declining (-3.0%/yr); year-one equity from $1k of loan paydown is wiped out by about $6k of value loss. Plan a longer hold.
- Jackson County population projected at +4% by 2050 — modest demand growth; plan on rents tracking national, not racing it.
Negotiation context
- Only 3 days on market — expect competitive offers; lowballing is unlikely to land.
- 2 sale attempts since 16y ago with the ask held roughly flat each time — persistent listings suggest the price (not the market) is what's stuck; bring a comps-based counter.
Questions for the listing agent
- What do current leases actually rent for vs. the listed asking? Can we see a recent rent roll and the last 12 months of T-12 income?
- Built in 1969 — when were the roof, HVAC, electrical panel, plumbing, and water heater last replaced?
- What does the HOA fee cover, when was the last increase, and are there any pending special assessments or reserve-fund shortfalls?
- Is there a deadline driving the sale (1031 exchange, divorce, estate, relocation)? That informs how much negotiation room exists.
- The area grade is low — what's the realistic commute time and amenity access for the typical tenant pool here? Any planned neighborhood developments (good or bad) we should know about?
- What's the average days-on-market for RENTAL listings here right now (not sales)? A rising rental-DOM trend means longer vacancies and softer asking-rent achievability than the comps imply.
- What's the recent tenant-quality profile in this submarket — average credit score on applications, eviction rate, late-payment / NSF rate, and stable-employment percentage? A property-management company in the area should have these aggregated.
- How much new for-sale + rental construction is in the pipeline within 1–3 miles? Heavy new supply typically softens prices + rents 12–24 months out; constrained supply supports both.
Investment metrics
- 1% rule
- 0.80% ✗
- Cap rate
- 6.18%
- Cash-on-cash
- -0.39%
- DSCR
- 0.98
- GRM
- 10.4
CMA / ARV
- ARV (on-the-fly)
- $300,672
- Comps found
- 12
Show comp detail 12 sales within ~0.75 mi
| Address | Dist | Beds/Ba | Sqft | Sold | Price | $/sf | Match |
|---|---|---|---|---|---|---|---|
| 3723 NE Colonial Dr | 0.00mi | 3/1.5 | 1,296 (0%) | 0mo | $210,000 | $162 | 100 |
| 3725 NE Colonial Dr | 0.00mi | 3/1.5 | 1,144 (-12%) | 6mo | $215,000 | $188 | 76 |
| 160 NE Bayview Dr | 0.68mi | 2/1.5 (-1) | 1,326 (+2%) | 1mo | $225,000 | $170 | 59 |
| 3552 NE Austin Dr | 0.30mi | 3/3.5 | 1,353 (+4%) | 17mo | $248,000 | $183 | 56 |
| 3919 NE Sequoia St | 0.51mi | 2/2.0 (-1) | 1,265 (-2%) | 16mo | $275,000 | $217 | 52 |
| 222 NE Bayview Dr | 0.68mi | 2/1.5 (-1) | 1,325 (+2%) | 18mo | $319,000 | $241 | 44 |
| 792 NE Algonquin St | 0.63mi | 2/2.0 (-1) | 1,451 (+12%) | 0mo | $415,000 | $286 | 44 |
| 821 NE Lone Hill Dr | 0.67mi | 2/2.0 (-1) | 1,433 (+11%) | 1mo | $395,000 | $276 | 43 |
| 206 NE Bayview Dr | 0.70mi | 4/3.0 (+1) | 1,366 (+5%) | 6mo | $259,900 | $190 | 42 |
| 4017 NE Sagamore Dr | 0.72mi | 2/2.0 (-1) | 1,480 (+14%) | 1mo | $384,000 | $259 | 35 |
| 218 NE Bayview Dr | 0.69mi | 2/2.0 (-1) | 1,465 (+13%) | 11mo | $340,000 | $232 | 30 |
| 827 NE Algonquin St Unit B | 0.68mi | 2/2.0 (-1) | 1,451 (+12%) | 14mo | $439,000 | $303 | 30 |
Match score weights: distance 35% · size 25% · config 20% · recency 20%. Top-matched comps best support the ARV.
Projected returns pro-forma
-3.0% appreciation · 5.14% rent growth · sell at horizon
- IRR
- -14.8%
- Equity multiple
- 0.46×
- Total profit
- $-31,579
- Equity at exit
- $31,312
- IRR
- -3.1%
- Equity multiple
- 0.77×
- Total profit
- $-13,308
- Equity at exit
- $18,157
Cash invested: $58,800 (down + closing). Projections, not guarantees.
Landlord ↔ Tenant lean methodology
- Overall (STATE)
- 81 Strongly Landlord-Friendly
- State Missouri
- 81 Strongly Landlord-Friendly · R+10
- County
- — inherits STATE
- City
- — inherits STATE
ZIP-level market 64064
- Rents YoY
- 5.1%
- Active inventory
- 231
- Price-to-rent
- 10.4×
Monthly cashflow live
- Estimated rent
- $1,688 high interval (Pro) →
- Mortgage (P&I)
- −$1,101
- Tax from tax record
- −$113 /mo · $1,354/yr
- Insurance
- −$88
- HOA
- −$51
- Vacancy / Maint / Mgmt
- −$354
- Net cashflow
- $-19
Break-even live
UW: 25.0% down · 7.5% · 30yr · 1.5% tax · 5.0% vac · 8.0% maint · 8.0% mgmt
Financing live
Cash to close
- Down payment
- $52,500
- Closing costs
- $6,300
- Reserves months
- —
- Total cash needed
- —
Loan-product check · same deal, 3 products live
Conventional
25% down · 7.5% · 30yr
- Down + closing
- —
- Monthly P&I
- —
- Monthly cashflow
- —
- DSCR
- —
- Eligible?
- —
Personal DTI + credit; lowest rate.
DSCR
20% down · 8.5% · 30yr
- Down + closing
- —
- Monthly P&I
- —
- Monthly cashflow
- —
- DSCR
- —
- Eligible?
- —
No personal income docs; deal must DSCR.
Hard money
10% down · 12.0% · 12mo
- Down + closing
- —
- Monthly P&I
- —
- Monthly cashflow
- —
- DSCR
- —
- Eligible?
- —
Short-term bridge; refi at stabilization.
Rent comps 7 comps
| Address | Beds | Baths | Sqft | Rent | $/sqft | DOM | Units | Dist |
|---|---|---|---|---|---|---|---|---|
| 3546 NE Independence Ave Lee's Summit, MO | 3.0 | 1.5 | 960 | $1,495 | $1.56 | 20d | 1 | 0.40mi |
| 3562 NE Independence Ave Lee's Summit, MO | 3.0 | 1.5 | 1300 | $1,375 | $1.06 | 3d | 1 | 0.42mi |
| 3562 NE Independence Ave Unit 3562 Lee's Summit, MO | 3.0 | 1.5 | 1300 | $1,375 | $1.06 | 4d | 1 | 0.42mi |
| 3563 NE Independence Cir Lee's Summit, MO | 3.0 | 1.5 | 1365 | $1,405 | $1.03 | 14d | 1 | 0.48mi |
| 3557 NE Independence Cir Lees Summit, MO | 3.0 | 1.5 | 1365 | $1,438 | $1.05 | 12d | 1 | 0.48mi |
| 3557 NE Independence Cir Lees Summit, MO | 3.0 | 1.5 | 1365 | $1,405 | $1.03 | 4d | 1 | 0.48mi |
| 3460 NE Akin Blvd Lees Summit, MO | 1.0–3.0 | 1.0–2.0 | 1037 | $2,113 | $2.04 | 1d | 21 | 0.67mi |
HOA detail
- Monthly dues
- $51 · $612/yr
Listing history 6 events
-
2026-05-21$210,000 Active
-
2026-05-18historical $210,000
-
2013-01-02soldstatus
-
2010-10-22soldstatus 365-char remark
Show marketing remark (365 chars)
RARE FIND- 3 BR townhome w/ 2 car garage in Lee's Summit/Blue Springs area for under $75k! 2 sty layout features Fam rm, Kit w/ eat-in area & 1/2 BA on main level. 3 BRs & full bathroom upstairs- Master BR has his & hers closets. Privacy fence around patio, lower level utility rm. Maint provided. LS address, Blue Springs schools- great location!
-
2010-05-17$46,900 365-char remark
Show marketing remark (365 chars)
RARE FIND- 3 BR townhome w/ 2 car garage in Lee's Summit/Blue Springs area for under $75k! 2 sty layout features Fam rm, Kit w/ eat-in area & 1/2 BA on main level. 3 BRs & full bathroom upstairs- Master BR has his & hers closets. Privacy fence around patio, lower level utility rm. Maint provided. LS address, Blue Springs schools- great location!
-
1996-10-24soldstatus
ⓘ Source: listings_history table (triggers on properties + properties_extension) + one-shot
backfill from property_details.listing_events for pre-trigger history.
Tax reassessment forecast MO · Resets to sale price
- Current annual tax
- $1,354 · $113/mo
- Projected year-2 tax
- $2,037 · $170/mo
- Expected delta
- +$683/yr (+$57/mo · 50.4%)
ⓘ Screening estimate from a state-policy table — verify with the county assessor before closing.
Climate risk First Street
- Flood 1/10 Low FEMA zone X (unshaded) · 0% chance over 30 yrs
- Wildfire 1/10 Low
- Heat 4/10 Moderate 7 d/yr ≥106°F today · 16 d/yr by 30 yrs out
- Wind 2/10 Low
- Air quality 3/10 Moderate 3 unhealthy d/yr today · 3 by 30 yrs out
Nearby sold comps map
Loading sold comps map…
Walkable amenities ~0.75 mi
Loading nearby amenities…
Taxation est. · year 1
- Rental income
- $20,254
- − Mortgage interest
- −$11,763
- − Property taxes
- −$1,354
- − Insurance
- −$1,050
- − Repairs & maintenance
- −$1,620
- − Management
- −$1,620
- − HOA
- −$612
- − Depreciation
- −$6,109
- Taxable loss
- −$3,876
- Est. tax savings @ 24.0%
- +$930
- After-tax cash flow
- $699/yr
For passive investors: Depreciation is non-cash, so a rental often shows a tax loss while cash-flowing — sheltering income. Rental losses are passive: they offset passive income freely, and up to $25,000/yr can offset ordinary (W-2) income if you actively participate and your MAGI is under $100k (phasing out to $0 by $150k); unused losses carry forward. On sale, claimed depreciation is recaptured at up to 25%, and gains may owe capital-gains tax (a 1031 exchange can defer both). Figures are a year-1 estimate at your 24.0% rate — not tax advice; consult a CPA.
Schools (NCES district)
- District
- Blue Springs R-IV
- NCES district ID
- 2905310
- Math proficiency
- 55% ▼ -10.00%
- Reading proficiency
- 60% ▼ -6.00%
- Median HH income
- $67,959
- Composite
- 50.71/100
- National rank
- #1819
- State rank
- #17 of 324 in MO
Livability — Lee's Summit
No livability data for this city. (Only ~50 U.S. cities are tracked.)
Census & demographics
- Census place
- Lee's Summit, MO
- County
- Jackson County · 687,798 people
- City population
- 86,407
- Metro
- Kansas City, MO-KS
- Population (ZIP)
- 20,050
- Household income
- $117,674
- Rent vs Own
- Severe rent burden
- 124.0
Population outlook (Jackson County) Hauer SSP2
- Today (2025)
- 719,589 people
- By 2030
- 731,456 · +1.6%
- By 2040
- 746,689 · +3.8%
- By 2050
- 749,289 · +4.1%
- By 2075
- 736,227 · +2.3%
- By 2100
- 668,210 · -7.1%
Race, ethnicity, and origin ACS 2023
- Neighborhood character
- Predominantly White (80%)
- Race & ethnicity
- White 80% Black 10% Two or more races 5% Hispanic / Latino 4% Asian 2%
- Common ancestry
- Italian 8% Lithuanian 3% Slovak 2%
- Foreign-born
- 3% · Canada, Vietnam
- Languages at home
- 95% English-only · Spanish 2% Tagalog/Filipino 1% Other Indo-European 1%
Political lean MEDSL · Jackson
- 2024 margin
- D (+19.3) · D 58.9% · R 39.5% · Other 1.6%
- 2008→2024 swing
- -6.1pp toward R · 2008: 25.4pp · 2024: 19.3pp
- All cycles
- 2024: D+19.3 2020: D+22.0 2016: D+16.6 2012: D+19.0 2008: D+25.4
Not yet ingested
- Civics
- —
Market trends
- HPI YoY
- ▼ -178.97%
- Current HPI
- 230.5222
- Rent YoY
- ▲ 5.14%
- Metro
- Kansas City, MO-KS
- State GDP YoY
- ▲ 1.84%
- F500 in state
- 20
Industry mix (Fortune 500 HQ in MO)
| Industry | F500 HQs | Revenue |
|---|---|---|
| Healthcare | 1 | $163B |
|
||
| Insurance | 1 | $21B |
|
||
| Industrial Technology | 1 | $17B |
|
||
| Retail | 1 | $16B |
|
||
| Industrial Distribution | 1 | $10B |
|
||
| Utilities | 1 | $9B |
|
||
Price history
+347.8% since first listed6 events — show timeline
- 2026-05-21 Listed $210,000 Heartland MLS as Distributed by MLS Grid
- 2026-05-18 Coming Soon $210,000 Heartland MLS as Distributed by MLS Grid
- 2013-01-02 Sold (Public Records) — Public Records
- 2010-10-22 Sold (MLS) — Heartland MLS as Distributed by MLS Grid
- 2010-05-17 Listed $46,900 Heartland MLS as Distributed by MLS Grid
- 1996-10-24 Sold (Public Records) — Public Records
Property tax history
+5.9%/yrLatest (2025): $1,354 · -29.9% YoY. Source: county tax records.
Cash-flow waterfall
monthlySold comps — $/sqft
last 12 mo · ≤1 miLoading sold comps…