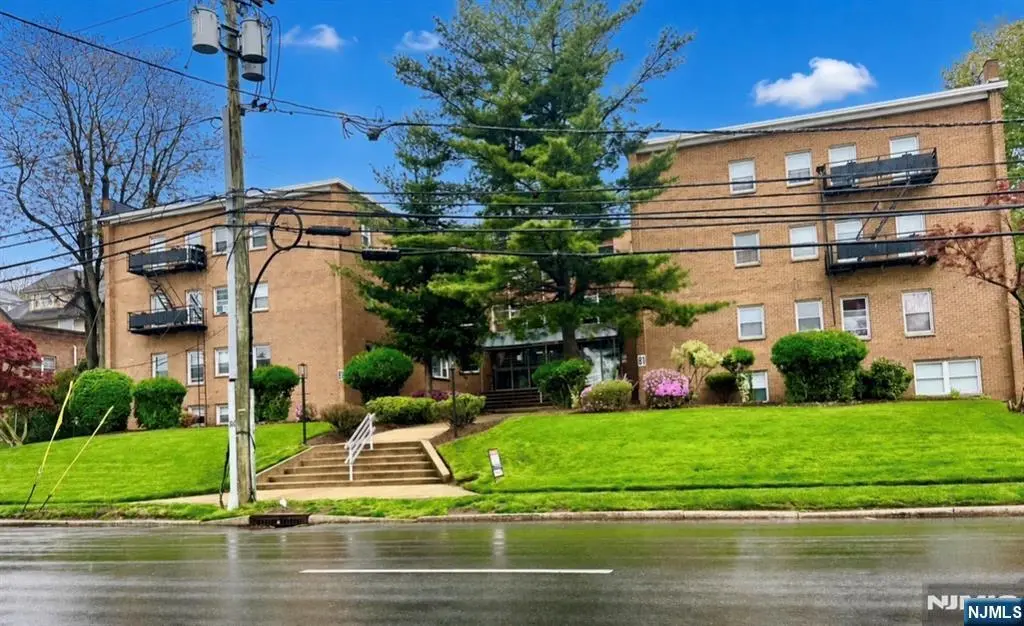
81 Grand Ave
Englewood, NJ 07631
$259,900F
2 bd · 2.0 ba ·
42,770 sqft ·
Built 2000
· Townhouse
· Active
· 40 DOM
Cashflow @ list (25.0% down · 7.5%)
Estimated rent
$2,962/mo
Mortgage (P&I)
−$1,363
Tax + insurance
−$433
HOA
−$1,203
Vac / Maint / Mgmt
−$622
Net cashflow
$-659/mo
Annual
$-7,906/yr
Cap rate
3.25%
Cash-on-cash
-10.86%
DSCR
0.52
1% rule
1.14%
Cash to close
$72,772
Investor read
- This is a 2-bed/2.0-bath townhouse listed at $260k.
- At list price, monthly cash flow is $-659 ($-8k/yr) — negative.
- To cash-flow at today's rent, offer at most $165k (36.7% below list).
- Meets the 1% rule at list price ($3k rent vs $260k).
- It's been on market 40 days — a 3% lower offer ($252k) is reasonable based on typical stale-listing flexibility.
- Recommended offer: $165k (36.7% below list) — sets the bar for cash-flow.
- Local home prices are declining (-3.0%/yr); year-one equity from $2k of loan paydown is wiped out by about $8k of value loss. Plan a longer hold.
- Location reads 76/100 on livability (#137 in NJ, #3,606 nationally) — a middle-class / working-renter tenant base. Strengths: employment A+, housing A, health & safety A; Watch: amenities F, cost of living F.
- Englewood Public School District (suburban): math 12% / reading 35% proficiency, ranked #383 of 472 in NJ (top 81%) — low school quality limits family demand, transient renter base, plan for 1-2y turnover.
- Watch-outs: HOA is 41% of rent.
- Market conditions: Rents rising fast (+7.8%/yr); 71 active listings in the ZIP; solid renter incomes; 3,488 units permitted in Bergen County in 2024 (1,610 in 5+ unit buildings).
- Bergen County population projected at +20% by 2050 — long-run rental-demand tailwind backs the buy-and-hold thesis.
- Climate carrying-cost: major wind risk, 27% chance of damaging wind over 30y; extreme-heat days projected 7→15/yr by 2055 (HVAC capex compounding) — expect insurance premiums to compound above CPI over the hold.
- This rent runs 35% of the median local income ($103k/yr) — at the standard rent-burdened threshold; future hikes will face affordability resistance.
Questions for listing agent
- What do current leases actually rent for vs. the listed asking? Can we see a recent rent roll and the last 12 months of T-12 income?
- It's been on market 40 days. Have you received any prior offers? Is the seller open to a 37% concession, seller financing, or rate buy-down credit?
- What does the HOA fee cover, when was the last increase, and are there any pending special assessments or reserve-fund shortfalls?
- Is there a deadline driving the sale (1031 exchange, divorce, estate, relocation)? That informs how much negotiation room exists.
- The area grade is low — what's the realistic commute time and amenity access for the typical tenant pool here? Any planned neighborhood developments (good or bad) we should know about?
- What's the average days-on-market for RENTAL listings here right now (not sales)? A rising rental-DOM trend means longer vacancies and softer asking-rent achievability than the comps imply.
- What's the recent tenant-quality profile in this submarket — average credit score on applications, eviction rate, late-payment / NSF rate, and stable-employment percentage? A property-management company in the area should have these aggregated.
- How much new for-sale + rental construction is in the pipeline within 1–3 miles? Heavy new supply typically softens prices + rents 12–24 months out; constrained supply supports both.
CashFlowRE · CFR-PPV7WN1QAA3K0D
· Data 2 days ago
cashflowre.app · 2026-05-29