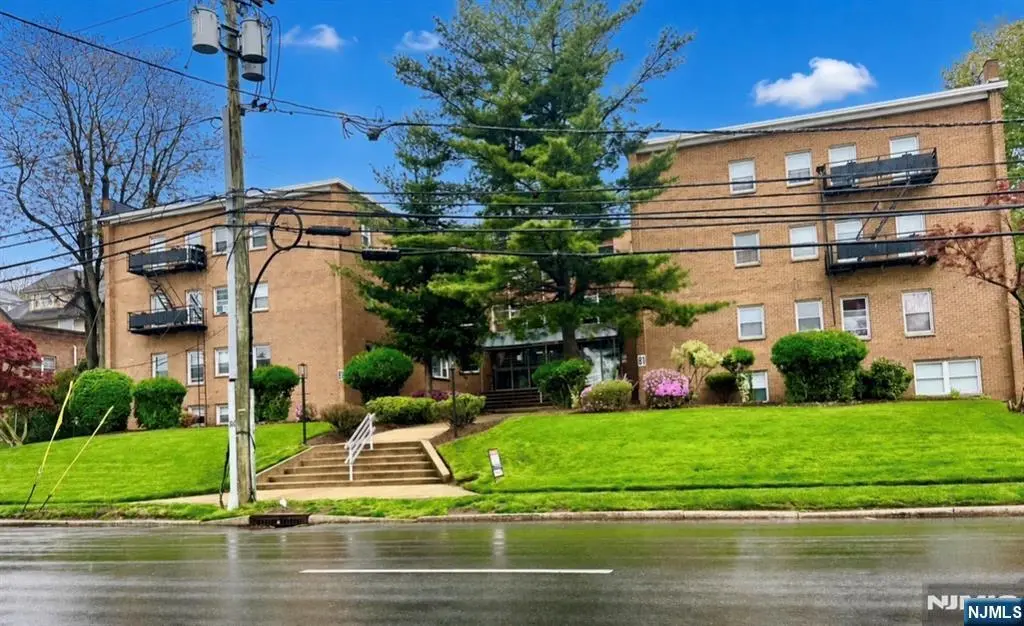
81 Grand Ave · Englewood, NJ
Flood risk 1/10 · Minimal
- FEMA flood zone
- X (unshaded)
- Chance of flooding over 30 yrs
- 0.0%
- Est. flood insurance / yr
- $507 – $1,088
Fire risk 1/10 · Minimal
- Est. fire insurance / yr
- $526 – $976
Heat risk 7/10 · Major
- Hot days now (above 99°F)
- 7 days/yr
- Hot days in 30 yrs
- 15 days/yr
Wind risk 6/10 · Moderate
- Chance of severe wind over 30 yrs
- 27.0%
Air-quality risk 4/10 · Minor
- Unhealthy air days now
- 4 days/yr
- Unhealthy air days in 30 yrs
- 7 days/yr
Risk factors via First Street. Map © Google.
Why this score? — see what drove the F grade
The composite is a weighted blend of 9 inputs, each scored 0–100. Each bar is that input's sub-score; the figure is the points it added to the 100-point composite (weight × sub-score).
- ARV discount +7.5/15.0
- 1% rule +6.4/10.0
- Cash flow +4.6/30.0
- Rent growth +4.5/5.0
- Livability +3.8/5.0
- Condition / age +2.5/5.0
- Schools +2.3/10.0
- DSCR +0.0/10.0
- Appreciation +0.0/10.0
$259,900
🖨 Deal sheet 📄 Offer letter ✓ Due diligence
Listing remarks
Welcome to The Eastwood co-op of Englewood. This lovely quaint brick building was built in 1970 and has 32 co-op units. This mid rise building has an elevator and is conveniently located to downtown Englewood. There’s transportation at your door. This large first floor 2 Bedroom 2 bath unit has lovely hardwood floors. There is lots of closet space and a full basement with coin operated washer and dryers. There is assigned parking space number 10.
Key facts
- Downtown englewood
- Elevator
- Full basement
Tags
Property features AI
Finance
- Other: Information not provided
- Financial info: Information not provided
- HOA & community: Has homeowners association; Monthly association fee of $1,203; Building: The Eastwood
Exterior
- Parking: 1 parking space
- Security: Information not provided
- Utilities: Information not provided
- Home design: Residential stock cooperative; Faces west
- Construction: Information not provided
- Exterior features: Pets allowed
Interior
- Kitchen: Range; Oven; Refrigerator
- Bedrooms: Information not provided
- Flooring: Hardwood
- Bathrooms: 2 full bathrooms
- Heating & cooling: Heat pump heating; Window air conditioning units
- Interior features: Elevator; Partially finished basement
- Laundry & utility: Laundry in basement; Shared/common area laundry
Neighborhood map
What this means for you Summary
Snapshot
- This is a 2-bed/2.0-bath townhouse listed at $260k.
Deal economics
- At list price, monthly cash flow is $-661 ($-8k/yr) — negative.
- To cash-flow at today's rent, offer at most $164k (36.8% below list).
- Meets the 1% rule at list price ($3k rent vs $260k).
- Recommended offer: $164k (36.8% below list) — sets the bar for cash-flow.
Location & tenants
- Location reads 76/100 on livability (#137 in NJ, #3,606 nationally) — a middle-class / working-renter tenant base. Strengths: employment A+, housing A, health & safety A; Watch: amenities F, cost of living F.
- Englewood Public School District (suburban): math 12% / reading 35% proficiency, ranked #383 of 472 in NJ (top 81%) — low school quality limits family demand, transient renter base, plan for 1-2y turnover.
- Market conditions: Rents rising fast (+7.8%/yr); 71 active listings in the ZIP; solid renter incomes; 3,488 units permitted in Bergen County in 2024 (1,610 in 5+ unit buildings).
- This rent runs 35% of the median local income ($103k/yr) — at the standard rent-burdened threshold; future hikes will face affordability resistance.
Forward outlook
- Local home prices are declining (-3.0%/yr); year-one equity from $2k of loan paydown is wiped out by about $8k of value loss. Plan a longer hold.
- Bergen County population projected at +20% by 2050 — long-run rental-demand tailwind backs the buy-and-hold thesis.
Negotiation context
- It's been on market 40 days — a 3% lower offer ($252k) is reasonable based on typical stale-listing flexibility.
Risks & watch-outs
- Watch-outs: HOA is 41% of rent.
- Climate carrying-cost: major wind risk, 27% chance of damaging wind over 30y; extreme-heat days projected 7→15/yr by 2055 (HVAC capex compounding) — expect insurance premiums to compound above CPI over the hold.
Questions for the listing agent
- What do current leases actually rent for vs. the listed asking? Can we see a recent rent roll and the last 12 months of T-12 income?
- It's been on market 40 days. Have you received any prior offers? Is the seller open to a 37% concession, seller financing, or rate buy-down credit?
- What does the HOA fee cover, when was the last increase, and are there any pending special assessments or reserve-fund shortfalls?
- Is there a deadline driving the sale (1031 exchange, divorce, estate, relocation)? That informs how much negotiation room exists.
- The area grade is low — what's the realistic commute time and amenity access for the typical tenant pool here? Any planned neighborhood developments (good or bad) we should know about?
- What's the average days-on-market for RENTAL listings here right now (not sales)? A rising rental-DOM trend means longer vacancies and softer asking-rent achievability than the comps imply.
- What's the recent tenant-quality profile in this submarket — average credit score on applications, eviction rate, late-payment / NSF rate, and stable-employment percentage? A property-management company in the area should have these aggregated.
- How much new for-sale + rental construction is in the pipeline within 1–3 miles? Heavy new supply typically softens prices + rents 12–24 months out; constrained supply supports both.
Investment metrics
- 1% rule
- 1.14% ✓
- Cap rate
- 3.24%
- Cash-on-cash
- -10.91%
- DSCR
- 0.51
- GRM
- 7.3
CMA / ARV
No comps found within radius.
Projected returns pro-forma
-3.0% appreciation · 7.84% rent growth · sell at horizon
- IRR
- -25.9%
- Equity multiple
- 0.06×
- Total profit
- $-68,339
- Equity at exit
- $38,752
- IRR
- -6.7%
- Equity multiple
- 0.42×
- Total profit
- $-42,005
- Equity at exit
- $22,471
Cash invested: $72,772 (down + closing). Projections, not guarantees.
Landlord ↔ Tenant lean methodology
- Overall (STATE)
- 21 Tenant-Leaning
- State New Jersey
- 21 Tenant-Leaning · D+6
- County
- — inherits STATE
- City
- — inherits STATE
ZIP-level market 07631
- Rents YoY
- 7.8%
- Active inventory
- 71
- Price-to-rent
- 7.3×
Monthly cashflow live
- Estimated rent
- $2,959 medium interval (Pro) →
- Mortgage (P&I)
- −$1,363
- Tax est. 1.5%
- −$325 /mo · $3,898/yr
- Insurance
- −$108
- HOA
- −$1,203
- Vacancy / Maint / Mgmt
- −$621
- Net cashflow
- $-661
Break-even live
Sensitivity live
| Price | -10% $-482 | -5% $-572 | +0% $-661 | +5% $-751 | +10% $-841 |
|---|---|---|---|---|---|
| Rent | -10% $-895 | -5% $-778 | +0% $-661 | +5% $-544 | +10% $-428 |
| Rate | -1.0pp $-530 | -0.5pp $-595 | base $-661 | +0.5pp $-729 | +1.0pp $-797 |
UW: 25.0% down · 7.5% · 30yr · 1.5% tax · 5.0% vac · 8.0% maint · 8.0% mgmt
Financing live
Cash to close
- Down payment
- $64,975
- Closing costs
- $7,797
- Reserves months
- —
- Total cash needed
- —
Loan-product check · same deal, 3 products live
Conventional
25% down · 7.5% · 30yr
- Down + closing
- —
- Monthly P&I
- —
- Monthly cashflow
- —
- DSCR
- —
- Eligible?
- —
Personal DTI + credit; lowest rate.
DSCR
20% down · 8.5% · 30yr
- Down + closing
- —
- Monthly P&I
- —
- Monthly cashflow
- —
- DSCR
- —
- Eligible?
- —
No personal income docs; deal must DSCR.
Hard money
10% down · 12.0% · 12mo
- Down + closing
- —
- Monthly P&I
- —
- Monthly cashflow
- —
- DSCR
- —
- Eligible?
- —
Short-term bridge; refi at stabilization.
HOA detail
- Monthly dues
- $1,203 · $14,436/yr
- Likely covers
- parking
Listing history 18 events
-
2026-06-18days on market $259,900 Active 40 DOM
-
2026-06-17days on market $259,900 Active 39 DOM
-
2026-06-16days on market $259,900 Active 38 DOM
-
2026-06-15days on market $259,900 Active 37 DOM
-
2026-06-13days on market $259,900 Active 35 DOM
-
2026-06-13days on market $259,900 Active 34 DOM
-
2026-06-09days on market $259,900 Active 31 DOM
-
2026-06-08days on market $259,900 Active 30 DOM
-
2026-06-07days on market $259,900 Active 29 DOM
-
2026-06-04days on market $259,900 Active 26 DOM
-
2026-06-03days on market $259,900 Active 25 DOM
-
2026-06-02days on market $259,900 Active 24 DOM
-
2026-06-01days on market $259,900 Active 23 DOM
-
2026-05-31days on market $259,900 Active 22 DOM
-
2026-05-09$259,900 Active
-
1988-03-01soldstatus $1,600,000
-
1983-11-01soldstatus $1,350,000
-
1981-05-01soldstatus $2,100,000
ⓘ Source: listings_history table (triggers on properties + properties_extension) + one-shot
backfill from property_details.listing_events for pre-trigger history.
Climate risk First Street
- Flood 1/10 Low FEMA zone X (unshaded) · 0% chance over 30 yrs
- Wildfire 1/10 Low
- Heat 7/10 Severe 7 d/yr ≥99°F today · 15 d/yr by 30 yrs out
- Wind 6/10 Major 27% chance of damaging wind over 30 yrs
- Air quality 4/10 Moderate 4 unhealthy d/yr today · 7 by 30 yrs out
Nearby sold comps map
Loading sold comps map…
Walkable amenities ~0.75 mi
Loading nearby amenities…
Taxation est. · year 1
- Rental income
- $35,510
- − Mortgage interest
- −$14,558
- − Property taxes
- −$3,898
- − Insurance
- −$1,300
- − Repairs & maintenance
- −$2,841
- − Management
- −$2,841
- − HOA
- −$14,436
- − Depreciation
- −$7,561
- Taxable loss
- −$11,925
- Est. tax savings @ 24.0%
- +$2,862
- After-tax cash flow
- $-5,074/yr
For passive investors: Depreciation is non-cash, so a rental often shows a tax loss while cash-flowing — sheltering income. Rental losses are passive: they offset passive income freely, and up to $25,000/yr can offset ordinary (W-2) income if you actively participate and your MAGI is under $100k (phasing out to $0 by $150k); unused losses carry forward. On sale, claimed depreciation is recaptured at up to 25%, and gains may owe capital-gains tax (a 1031 exchange can defer both). Figures are a year-1 estimate at your 24.0% rate — not tax advice; consult a CPA.
Schools (NCES district)
- District
- Englewood Public School District
- NCES district ID
- 3404740
- Math proficiency
- 12% ▼ -8.00%
- Reading proficiency
- 35% ▼ -9.00%
- Median HH income
- $72,871
- Composite
- 22.91/100
- National rank
- #8000
- State rank
- #383 of 472 in NJ
Livability — Englewood
- Score
- 76/100
- State rank
- #137
- US rank
- #3606
Category grades
Schools grade is shown separately in the Schools card above.
Census & demographics
- Census place
- Englewood, NJ
- County
- Bergen County · 586,961 people
- City population
- 29,638
- Metro
- New York-Newark-Jersey City, NY-NJ-PA
- Population (ZIP)
- 29,638
- Household income
- $102,571
- Rent vs Own
- Severe rent burden
- 1812.0
Population outlook (Bergen County) Hauer SSP2
- Today (2025)
- 1,021,896 people
- By 2030
- 1,063,119 · +4.0%
- By 2040
- 1,146,566 · +12.2%
- By 2050
- 1,229,132 · +20.3%
- By 2075
- 1,429,694 · +39.9%
- By 2100
- 1,547,614 · +51.4%
Race, ethnicity, and origin ACS 2023
- Neighborhood character
- Highly diverse neighborhood (Simpson 0.75)
- Race & ethnicity
- Hispanic / Latino 32% White 30% Black 19% Asian 13% Two or more races 12%
- Hispanic origin (detail)
- Mexican 3% Puerto Rican 3% Dominican 7%
- Common ancestry
- Scotch-Irish 2% Scandinavian 1% Romanian 1%
- Foreign-born
- 35% · Canada, Jamaica, South Korea
- Languages at home
- 53% English-only · Spanish 28% Korean 5% Other Indo-European 3%
Political lean MEDSL · Bergen
- 2024 margin
- Toss-up / Even · D 50.7% · R 47.3% · Other 2.0%
- 2008→2024 swing
- -6.1pp toward R · 2008: 9.5pp · 2024: 3.4pp
- All cycles
- 2024: D+3.4 2020: D+16.4 2016: D+12.0 2012: D+10.8 2008: D+9.5
Not yet ingested
- Civics
- —
Market trends
- HPI YoY
- ▼ -242.43%
- Current HPI
- 277.8765
- Rent YoY
- ▲ 7.84%
- Metro
- New York-Newark-Jersey City, NY-NJ-PA
- State GDP YoY
- ▲ 2.05%
- F500 in state
- 34
Industry mix (Fortune 500 HQ in NJ)
| Industry | F500 HQs | Revenue |
|---|---|---|
| Consumer Goods | 3 | $31B |
|
||
| Pharmaceuticals | 2 | $153B |
|
||
| Technology | 2 | $21B |
|
||
| Insurance | 2 | $20B |
|
||
| Healthcare | 2 | $19B |
|
||
| Financial Services | 1 | $70B |
|
||
Price history
-87.6% since first listed4 events — show timeline
- 2026-05-09 Listed $259,900 NJMLS
- 1988-03-01 Sold (Public Records) $1,600,000 Public Records
- 1983-11-01 Sold (Public Records) $1,350,000 Public Records
- 1981-05-01 Sold (Public Records) $2,100,000 Public Records
Property tax history
-0.9%/yrLatest (2025): $102,828 · +1.4% YoY. Source: county tax records.
Cash-flow waterfall
monthlySold comps — $/sqft
last 12 mo · ≤1 miLoading sold comps…