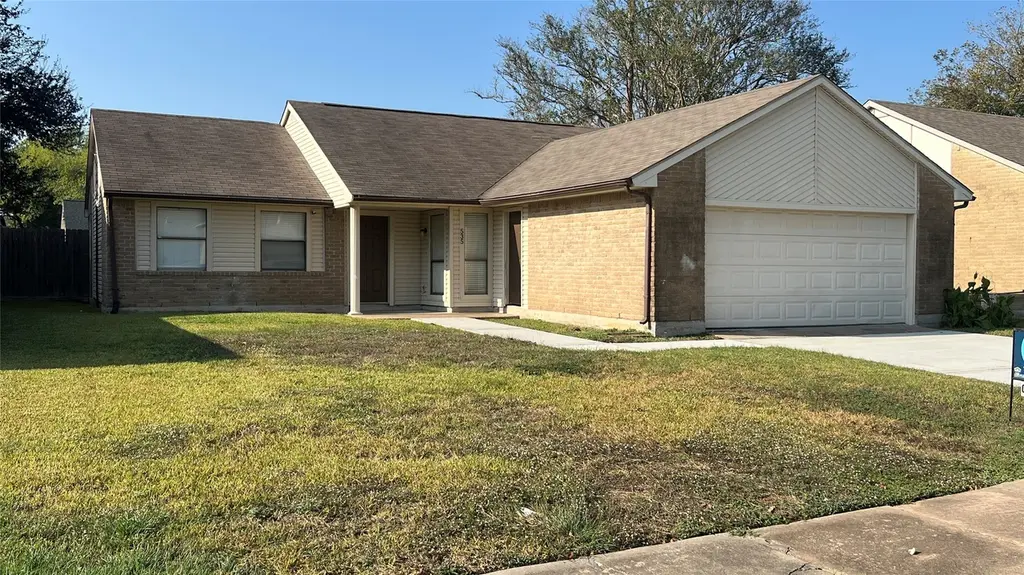
535 Jeff Davis Dr
Sugar Land, TX 77469
$199,900C
3 bd · 2.0 ba ·
1,419 sqft ·
Built 1982
· SingleFamily
· Active
· 188 DOM
Cashflow @ list (25.0% down · 7.5%)
Estimated rent
$2,079/mo
Mortgage (P&I)
−$1,048
Tax + insurance
−$440
HOA
−$22
Vac / Maint / Mgmt
−$437
Net cashflow
$132/mo
Annual
$1,579/yr
Cap rate
7.08%
Cash-on-cash
2.82%
DSCR
1.13
1% rule
1.04%
Cash to close
$55,972
Investor read
- This is a 3-bed/2.0-bath single-family listed at $200k.
- At list price, monthly cash flow is $132 ($2k/yr) — positive.
- The deal already cash-flows at list — no discount required.
- Meets the 1% rule at list price ($2k rent vs $200k).
- It's been on market 188 days — a 12% lower offer ($176k) is reasonable based on typical stale-listing flexibility.
- Recommended offer: $176k (12.0% below list) — sets the bar for market timing.
- Local home prices are declining (-3.0%/yr); year-one equity from $1k of loan paydown is wiped out by about $6k of value loss. Plan a longer hold.
- Location reads 80/100 on livability (#38 in TX, #1,758 nationally) — a professional / high-income tenant draw. Strengths: crime A+, employment A+, housing A+; Watch: cost of living D, commute F.
- Lamar CISD (suburban): math 50% / reading 53% proficiency, ranked #116 of 826 in TX (top 14%) — acceptable for families but not a draw, mixed tenant base, ~2y average lease.
- Market conditions: Rents soft (-1.8%/yr); 1344 active listings in the ZIP; 10 comparable units currently listed for rent nearby; rentals at typical pace (median 26d on market — plan ~3-4 weeks tenant-placement turnaround); 40% of comp listings sitting > 30 days — soft ceiling on asking rent; solid renter incomes; 12,093 units permitted in Fort Bend County in 2024 (815 in 5+ unit buildings).
- Fort Bend County population projected at +75% by 2050 — long-run rental-demand tailwind backs the buy-and-hold thesis.
- 3 sale attempts since 16y ago; this cycle's ask has dropped $35k (15%) from the opening price — seller is motivated, your offer sets the floor, not the list.
- Climate carrying-cost: severe wind risk, 99% chance of damaging wind over 30y; extreme-heat days projected 7→23/yr by 2055 (HVAC capex compounding) — expect insurance premiums to compound above CPI over the hold.
- Cap rate 7.1% vs local median 2.6% in Sugar Land — top-decile yield for the area; either an underpriced asset or a hidden risk that comps aren't pricing in. Stress-test before assuming the spread holds.
Questions for listing agent
- It's been on market 188 days. Have you received any prior offers? Is the seller open to a 12% concession, seller financing, or rate buy-down credit?
- What does the HOA fee cover, when was the last increase, and are there any pending special assessments or reserve-fund shortfalls?
- Why hasn't it sold? Are there any deal-killer items the seller is aware of (foundation, flood, title, zoning, code violations)?
- Is there a deadline driving the sale (1031 exchange, divorce, estate, relocation)? That informs how much negotiation room exists.
- Schools are A-rated — typically a magnet for longer-tenancy family renters. What's the average tenant stay here, and is there a school-zone premium baked into asking?
- What's the average days-on-market for RENTAL listings here right now (not sales)? A rising rental-DOM trend means longer vacancies and softer asking-rent achievability than the comps imply.
- What's the recent tenant-quality profile in this submarket — average credit score on applications, eviction rate, late-payment / NSF rate, and stable-employment percentage? A property-management company in the area should have these aggregated.
- How much new for-sale + rental construction is in the pipeline within 1–3 miles? Heavy new supply typically softens prices + rents 12–24 months out; constrained supply supports both.
CashFlowRE · CFR-PQ01GT477RMJ9H
· Data 2 weeks ago
cashflowre.app · 2026-05-29