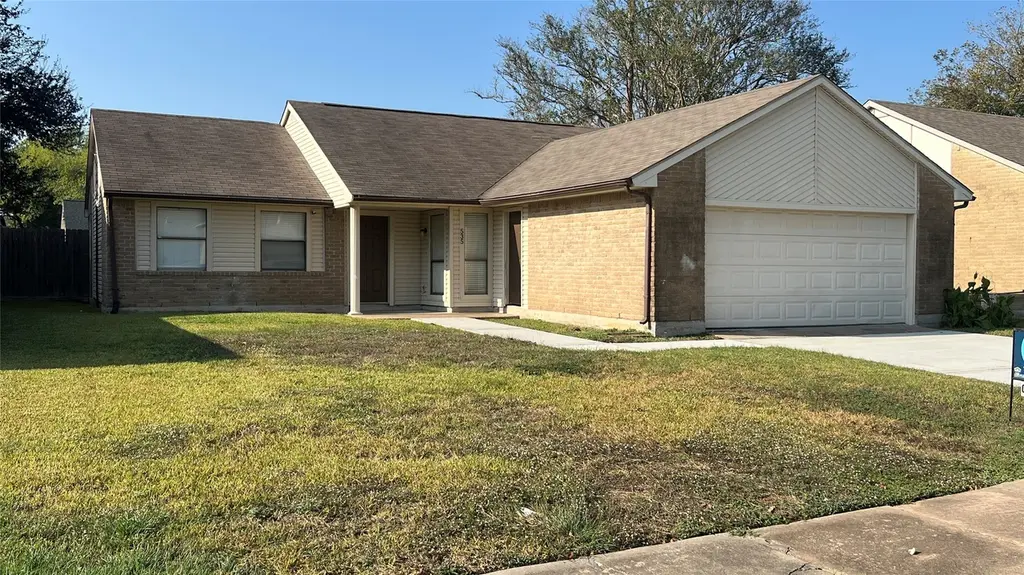
535 Jeff Davis Dr · Sugar Land, TX
Flood risk 1/10 · Minimal
- FEMA flood zone
- X (unshaded)
- Chance of flooding over 30 yrs
- 0.0%
- Est. flood insurance / yr
- $507 – $1,088
Fire risk 2/10 · Minimal
- Est. fire insurance / yr
- $1,222 – $2,270
Heat risk 9/10 · Severe
- Hot days now (above 110°F)
- 7 days/yr
- Hot days in 30 yrs
- 23 days/yr
Wind risk 9/10 · Severe
- Chance of severe wind over 30 yrs
- 99.0%
Air-quality risk 2/10 · Minimal
- Unhealthy air days now
- 1 days/yr
- Unhealthy air days in 30 yrs
- 1 days/yr
Risk factors via First Street. Map © Google.
Why this score? — see what drove the C grade
The composite is a weighted blend of 9 inputs, each scored 0–100. Each bar is that input's sub-score; the figure is the points it added to the 100-point composite (weight × sub-score).
- Cash flow +16.9/30.0
- ARV discount +14.3/15.0
- 1% rule +5.4/10.0
- DSCR +5.3/10.0
- Schools +4.6/10.0
- Livability +4.0/5.0
- Condition / age +2.5/5.0
- Rent growth +2.0/5.0
- Appreciation +0.0/10.0
$199,900
🖨 Deal sheet (PDF) 📄 Offer letter ✓ Due diligence
Listing remarks MLS
Newly priced, this charming Single-Family home boasts recent updates to the roof, driveway, paint, flooring, and appliances. Featuring granite counters, a bookshelf in the living area, and 2in blinds, this 3 bed, 2 bath property is a great find. Situated near schools and a neighborhood park, and adjacent to Greatwood, it offers convenience and comfort. Built in 1982 with 1419 sqft of living space on a 6196 sqft lot, this home is a must-see.
Key facts
- Recent driveway
- Book shelf in living
- Close to schools
Tags
Neighborhood map
What this means for you Summary
Snapshot
- This is a 3-bed/2.0-bath single-family listed at $200k.
Deal economics
- At list price, monthly cash flow is $132 ($2k/yr) — positive.
- The deal already cash-flows at list — no discount required.
- Meets the 1% rule at list price ($2k rent vs $200k).
- Recommended offer: $176k (12.0% below list) — sets the bar for market timing.
- Cap rate 7.1% vs local median 2.6% in Sugar Land — top-decile yield for the area; either an underpriced asset or a hidden risk that comps aren't pricing in. Stress-test before assuming the spread holds.
Location & tenants
- Location reads 80/100 on livability (#38 in TX, #1,758 nationally) — a professional / high-income tenant draw. Strengths: crime A+, employment A+, housing A+; Watch: cost of living D, commute F.
- Lamar CISD (suburban): math 50% / reading 53% proficiency, ranked #116 of 826 in TX (top 14%) — acceptable for families but not a draw, mixed tenant base, ~2y average lease.
- Market conditions: Rents soft (-1.8%/yr); 1332 active listings in the ZIP; 10 comparable units currently listed for rent nearby; rentals at typical pace (median 25d on market — plan ~3-4 weeks tenant-placement turnaround); 40% of comp listings sitting > 30 days — soft ceiling on asking rent; solid renter incomes; 12,093 units permitted in Fort Bend County in 2024 (815 in 5+ unit buildings).
Forward outlook
- Local home prices are declining (-3.0%/yr); year-one equity from $1k of loan paydown is wiped out by about $6k of value loss. Plan a longer hold.
- Fort Bend County population projected at +75% by 2050 — long-run rental-demand tailwind backs the buy-and-hold thesis.
Negotiation context
- It's been on market 188 days — a 12% lower offer ($176k) is reasonable based on typical stale-listing flexibility.
- 3 sale attempts since 16y ago; this cycle's ask has dropped $35k (15%) from the opening price — seller is motivated, your offer sets the floor, not the list.
Risks & watch-outs
- Climate carrying-cost: severe wind risk, 99% chance of damaging wind over 30y; extreme-heat days projected 7→23/yr by 2055 (HVAC capex compounding) — expect insurance premiums to compound above CPI over the hold.
Questions for the listing agent
- It's been on market 188 days. Have you received any prior offers? Is the seller open to a 12% concession, seller financing, or rate buy-down credit?
- What does the HOA fee cover, when was the last increase, and are there any pending special assessments or reserve-fund shortfalls?
- Why hasn't it sold? Are there any deal-killer items the seller is aware of (foundation, flood, title, zoning, code violations)?
- Is there a deadline driving the sale (1031 exchange, divorce, estate, relocation)? That informs how much negotiation room exists.
- Schools are A-rated — typically a magnet for longer-tenancy family renters. What's the average tenant stay here, and is there a school-zone premium baked into asking?
- What's the average days-on-market for RENTAL listings here right now (not sales)? A rising rental-DOM trend means longer vacancies and softer asking-rent achievability than the comps imply.
- What's the recent tenant-quality profile in this submarket — average credit score on applications, eviction rate, late-payment / NSF rate, and stable-employment percentage? A property-management company in the area should have these aggregated.
- How much new for-sale + rental construction is in the pipeline within 1–3 miles? Heavy new supply typically softens prices + rents 12–24 months out; constrained supply supports both.
Investment metrics
- 1% rule
- 1.04% ✓
- Cap rate
- 7.08%
- Cash-on-cash
- 2.82%
- DSCR
- 1.13
- GRM
- 8.0
CMA / ARV
- ARV (median comp)
- $235,506
- List price
- $199,900
- Delta
- -15.12%
- Verdict
- UNDERPRICED
- Comps
- 20 within 1.0 mi
Show comp detail 12 sales within ~0.75 mi
| Address | Dist | Beds/Ba | Sqft | Sold | Price | $/sf | Match |
|---|---|---|---|---|---|---|---|
| 627 Stonewall Dr | 0.09mi | 3/2.0 | 1,419 (0%) | 2mo | $235,000 | $166 | 94 |
| 535 Shenandoah Dr | 0.13mi | 3/2.0 | 1,470 (+4%) | 2mo | $225,000 | $153 | 86 |
| 6724 Pickett Dr | 0.23mi | 3/2.0 | 1,459 (+3%) | 2mo | $250,000 | $171 | 82 |
| 531 Tara Plantation Dr | 0.05mi | 3/2.0 | 1,515 (+7%) | 4mo | $260,000 | $172 | 82 |
| 6930 Kearney Dr | 0.33mi | 3/2.0 | 1,303 (-8%) | 1mo | $219,999 | $169 | 70 |
| 6915 Kearney Dr | 0.29mi | 4/2.0 (+1) | 1,517 (+7%) | 2mo | $250,000 | $165 | 68 |
| 6918 Gettysburg Dr | 0.17mi | 3/2.0 | 1,628 (+15%) | 1mo | $239,000 | $147 | 67 |
| 213 Willoughby Dr | 0.61mi | 3/2.0 | 1,470 (+4%) | 1mo | $244,880 | $167 | 64 |
| 6731 Gettysburg Dr | 0.22mi | 3/2.0 | 1,628 (+15%) | 1mo | $254,900 | $157 | 64 |
| 7126 Sharpsburg Dr | 0.31mi | 3/2.0 | 1,580 (+11%) | 4mo | $242,000 | $153 | 64 |
| 218 Tara Plantation Dr | 0.39mi | 3/2.0 | 1,580 (+11%) | 3mo | $235,000 | $149 | 60 |
| 222 Tara Plantation Dr | 0.37mi | 3/2.0 | 1,210 (-15%) | 3mo | $200,000 | $165 | 56 |
Match score weights: distance 35% · size 25% · config 20% · recency 20%. Top-matched comps best support the ARV.
Projected returns pro-forma
-3.0% appreciation · 0.0% rent growth · sell at horizon
- IRR
- -15.5%
- Equity multiple
- 0.46×
- Total profit
- $-29,992
- Equity at exit
- $29,806
- IRR
- -13.9%
- Equity multiple
- 0.31×
- Total profit
- $-38,418
- Equity at exit
- $17,284
Cash invested: $55,972 (down + closing). Projections, not guarantees.
Landlord ↔ Tenant lean methodology
- Overall (STATE)
- 87 Strongly Landlord-Friendly
- State Texas
- 87 Strongly Landlord-Friendly · R+5
- County
- — inherits STATE
- City
- — inherits STATE
ZIP-level market 77469
- Home prices YoY
- -25.1%
- Rents YoY
- -1.8%
- Active inventory
- 1332
- Price-to-rent
- 8.0×
Monthly cashflow live
- Estimated rent
- $2,079 high interval (Pro) →
- Mortgage (P&I)
- −$1,048
- Tax from tax record
- −$357 /mo · $4,286/yr
- Insurance
- −$83
- HOA
- −$22
- Vacancy / Maint / Mgmt
- −$437
- Net cashflow
- $132
Break-even live
Sensitivity live
| Price | -10% $245 | -5% $188 | +0% $132 | +5% $75 | +10% $18 |
|---|---|---|---|---|---|
| Rent | -10% $-33 | -5% $49 | +0% $132 | +5% $214 | +10% $296 |
| Rate | -1.0pp $232 | -0.5pp $182 | base $132 | +0.5pp $80 | +1.0pp $27 |
UW: 25.0% down · 7.5% · 30yr · 1.5% tax · 5.0% vac · 8.0% maint · 8.0% mgmt
Financing live
Cash to close
- Down payment
- $49,975
- Closing costs
- $5,997
- Reserves months
- —
- Total cash needed
- —
Loan-product check · same deal, 3 products live
Conventional
25% down · 7.5% · 30yr
- Down + closing
- —
- Monthly P&I
- —
- Monthly cashflow
- —
- DSCR
- —
- Eligible?
- —
Personal DTI + credit; lowest rate.
DSCR
20% down · 8.5% · 30yr
- Down + closing
- —
- Monthly P&I
- —
- Monthly cashflow
- —
- DSCR
- —
- Eligible?
- —
No personal income docs; deal must DSCR.
Hard money
10% down · 12.0% · 12mo
- Down + closing
- —
- Monthly P&I
- —
- Monthly cashflow
- —
- DSCR
- —
- Eligible?
- —
Short-term bridge; refi at stabilization.
Rent comps 10 comps
| Address | Beds | Baths | Sqft | Rent | $/sqft | DOM | Units | Dist |
|---|---|---|---|---|---|---|---|---|
| 6826 Blue Ridge Dr Richmond, TX | 3.0 | 2.0 | 1580 | $1,769 | $1.12 | 44d | 1 | 0.29mi |
| 6915 Renfro Dr Richmond, TX | 4.0 | 2.0 | 1517 | $1,745 | $1.15 | 21d | 1 | 0.44mi |
| 1601 Crabb River Rd Richmond, TX | 2.0 | 2.0 | 1149 | $1,939 | $1.69 | 19d | 1 | 0.63mi |
| 5200 Pointe West Cir Richmond, TX | 1.0–3.0 | 1.0–2.0 | 1125 | $2,550 | $2.27 | 2d | 16 | 1.20mi |
| 5200 Pointe West Cir Richmond, TX | 2.0 | 2.0 | 1149 | $1,939 | $1.69 | 44d | 1 | 1.20mi |
| 5200 Pointe West Cir Richmond, TX | 2.0 | 2.0 | 1149 | $1,939 | $1.69 | 25d | 1 | 1.20mi |
| 5200 Pointe West Cir Unit 5233 Richmond, TX | 3.0 | 2.0 | 1507 | $2,429 | $1.61 | 44d | 1 | 1.23mi |
| 5200 Pointe West Cir Unit 2174 Richmond, TX | 2.0 | 2.0 | 1149 | $1,943 | $1.69 | 17d | 1 | 1.23mi |
| 5200 Pointe West Cir Unit 5237 Richmond, TX | 2.0 | 2.0 | 1244 | $2,152 | $1.73 | 44d | 1 | 1.23mi |
| 5200 Pointe West Cir Unit 3174 Richmond, TX | 3.0 | 2.0 | 1507 | $2,306 | $1.53 | 17d | 1 | 1.23mi |
HOA detail
- Monthly dues
- $22 · $264/yr
Listing history 16 events
-
2026-06-07days on market $199,900 Active 188 DOM
-
2026-06-04days on market $199,900 Active 185 DOM
-
2026-06-03days on market $199,900 Active 184 DOM
-
2026-06-02days on market $199,900 Active 183 DOM
-
2026-06-01days on market $199,900 Active 182 DOM
-
2026-05-31days on market $199,900 Active 181 DOM
-
2026-05-15price $199,900 444-char remark
Show marketing remark (444 chars)
Newly priced, this charming Single-Family home boasts recent updates to the roof, driveway, paint, flooring, and appliances. Featuring granite counters, a bookshelf in the living area, and 2in blinds, this 3 bed, 2 bath property is a great find. Situated near schools and a neighborhood park, and adjacent to Greatwood, it offers convenience and comfort. Built in 1982 with 1419 sqft of living space on a 6196 sqft lot, this home is a must-see.
-
2026-03-05price $219,900 444-char remark
Show marketing remark (444 chars)
Newly priced, this charming Single-Family home boasts recent updates to the roof, driveway, paint, flooring, and appliances. Featuring granite counters, a bookshelf in the living area, and 2in blinds, this 3 bed, 2 bath property is a great find. Situated near schools and a neighborhood park, and adjacent to Greatwood, it offers convenience and comfort. Built in 1982 with 1419 sqft of living space on a 6196 sqft lot, this home is a must-see.
-
2026-02-06price $227,900 444-char remark
Show marketing remark (444 chars)
Newly priced, this charming Single-Family home boasts recent updates to the roof, driveway, paint, flooring, and appliances. Featuring granite counters, a bookshelf in the living area, and 2in blinds, this 3 bed, 2 bath property is a great find. Situated near schools and a neighborhood park, and adjacent to Greatwood, it offers convenience and comfort. Built in 1982 with 1419 sqft of living space on a 6196 sqft lot, this home is a must-see.
-
2025-12-01$235,000 Active 444-char remark
Show marketing remark (444 chars)
Newly priced, this charming Single-Family home boasts recent updates to the roof, driveway, paint, flooring, and appliances. Featuring granite counters, a bookshelf in the living area, and 2in blinds, this 3 bed, 2 bath property is a great find. Situated near schools and a neighborhood park, and adjacent to Greatwood, it offers convenience and comfort. Built in 1982 with 1419 sqft of living space on a 6196 sqft lot, this home is a must-see.
-
2011-08-01soldstatus 255-char remark
Show marketing remark (255 chars)
FORECLOSURE--- CHECK THIS PRICE!!!! 3 BEDROOM 2 BATH AND 2 CAR GARAGE HOME BUILT IN 1982!!! THIS COULD BE THE FORECLOSURE YOU ARE LOOKING FOR!!! BUYER OR BUYER S AGENT TO VERIFY ALL INFORMATION: SCHOOLS, TAXES, RESTRICTIONS AND ROOM SIZES, ETC. SOLD AS IS
-
2011-06-14historical 255-char remark
Show marketing remark (255 chars)
FORECLOSURE--- CHECK THIS PRICE!!!! 3 BEDROOM 2 BATH AND 2 CAR GARAGE HOME BUILT IN 1982!!! THIS COULD BE THE FORECLOSURE YOU ARE LOOKING FOR!!! BUYER OR BUYER S AGENT TO VERIFY ALL INFORMATION: SCHOOLS, TAXES, RESTRICTIONS AND ROOM SIZES, ETC. SOLD AS IS
-
2011-05-08$48,000 255-char remark
Show marketing remark (255 chars)
FORECLOSURE--- CHECK THIS PRICE!!!! 3 BEDROOM 2 BATH AND 2 CAR GARAGE HOME BUILT IN 1982!!! THIS COULD BE THE FORECLOSURE YOU ARE LOOKING FOR!!! BUYER OR BUYER S AGENT TO VERIFY ALL INFORMATION: SCHOOLS, TAXES, RESTRICTIONS AND ROOM SIZES, ETC. SOLD AS IS
-
2010-11-16historical
-
2010-06-03$95,900
-
2005-02-24soldstatus
ⓘ Source: listings_history table (triggers on properties + properties_extension) + one-shot
backfill from property_details.listing_events for pre-trigger history.
Tax reassessment forecast TX · Resets to sale price
- Current annual tax
- $4,286 · $357/mo
- Projected year-2 tax
- $4,286 · $357/mo
- Expected delta
- $0/yr ($0/mo · 0.0%)
ⓘ Screening estimate from a state-policy table — verify with the county assessor before closing.
Climate risk First Street
- Flood 1/10 Low FEMA zone X (unshaded) · 0% chance over 30 yrs
- Wildfire 2/10 Low
- Heat 9/10 Extreme 7 d/yr ≥110°F today · 23 d/yr by 30 yrs out
- Wind 9/10 Extreme 99% chance of damaging wind over 30 yrs
- Air quality 2/10 Low 1 unhealthy d/yr today · 1 by 30 yrs out
Nearby sold comps map
Loading sold comps map…
Walkable amenities ~0.75 mi
Loading nearby amenities…
Taxation est. · year 1
- Rental income
- $24,948
- − Mortgage interest
- −$11,198
- − Property taxes
- −$4,286
- − Insurance
- −$1,000
- − Repairs & maintenance
- −$1,996
- − Management
- −$1,996
- − HOA
- −$264
- − Depreciation
- −$5,815
- Taxable loss
- −$1,606
- Est. tax savings @ 24.0%
- +$386
- After-tax cash flow
- $1,965/yr
For passive investors: Depreciation is non-cash, so a rental often shows a tax loss while cash-flowing — sheltering income. Rental losses are passive: they offset passive income freely, and up to $25,000/yr can offset ordinary (W-2) income if you actively participate and your MAGI is under $100k (phasing out to $0 by $150k); unused losses carry forward. On sale, claimed depreciation is recaptured at up to 25%, and gains may owe capital-gains tax (a 1031 exchange can defer both). Figures are a year-1 estimate at your 24.0% rate — not tax advice; consult a CPA.
Schools (NCES district)
- District
- Lamar CISD
- NCES district ID
- 4826580
- Math proficiency
- 50% ▼ -12.00%
- Reading proficiency
- 53% ▼ -4.00%
- Median HH income
- $75,213
- Composite
- 46.43/100
- National rank
- #2452
- State rank
- #116 of 826 in TX
Livability — Sugar Land
- Score
- 80/100
- State rank
- #38
- US rank
- #1758
Category grades
Schools grade is shown separately in the Schools card above.
Census & demographics
- County
- Fort Bend County · 836,777 people
- City population
- 168,209
- Metro
- Houston-The Woodlands-Sugar Land, TX
- Population (ZIP)
- 69,826
- Household income
- $102,125
- Rent vs Own
- Severe rent burden
- 1292.0
Population outlook (Fort Bend County) Hauer SSP2
- Today (2025)
- 1,004,526 people
- By 2030
- 1,153,104 · +14.8%
- By 2040
- 1,453,718 · +44.7%
- By 2050
- 1,753,781 · +74.6%
- By 2075
- 2,455,772 · +144.5%
- By 2100
- 2,930,528 · +191.7%
Race, ethnicity, and origin ACS 2023
- Neighborhood character
- Highly diverse neighborhood (Simpson 0.76)
- Race & ethnicity
- Hispanic / Latino 29% White 27% Black 25% Two or more races 15% Asian 15%
- Hispanic origin (detail)
- Mexican 21%
- Common ancestry
- Romanian 1% Lithuanian 1%
- Foreign-born
- 24% · Canada, Vietnam, China
- Languages at home
- 65% English-only · Spanish 17% Other Indo-European 7% Other Asian/Pacific 2%
Political lean MEDSL · Fort Bend
- 2024 margin
- Toss-up / Even · D 49.5% · R 47.9% · Other 2.6%
- 2008→2024 swing
- +4.0pp toward D · 2008: -2.4pp · 2024: 1.6pp
- All cycles
- 2024: D+1.6 2020: D+10.6 2016: D+6.6 2012: R+6.8 2008: R+2.4
Not yet ingested
- Civics
- —
Market trends
- HPI YoY
- ▼ -78.66%
- Current HPI
- 234.9892
- Rent YoY
- ▼ -1.81%
- Metro
- Houston-The Woodlands-Sugar Land, TX
- State GDP YoY
- ▲ 3.95%
- F500 in state
- 110
Industry mix (Fortune 500 HQ in TX)
| Industry | F500 HQs | Revenue |
|---|---|---|
| Energy | 16 | $1,198B |
|
||
| Technology | 5 | $198B |
|
||
| Engineering / Construction | 4 | $72B |
|
||
| Energy Services | 3 | $60B |
|
||
| Utilities | 3 | $41B |
|
||
| Healthcare | 2 | $330B |
|
||
Price history
+108.4% since first listed10 events — show timeline
- 2026-05-15 Price Changed $199,900 HARMLS
- 2026-03-05 Price Changed $219,900 HARMLS
- 2026-02-06 Price Changed $227,900 HARMLS
- 2025-12-01 Listed $235,000 HARMLS
- 2011-08-01 Sold (MLS) — HARMLS
- 2011-06-14 Listing Removed — HARMLS
- 2011-05-08 Listed $48,000 HARMLS
- 2010-11-16 Listing Removed — HARMLS
- 2010-06-03 Listed $95,900 HARMLS
- 2005-02-24 Sold (Public Records) — Public Records
Property tax history
+5.0%/yrLatest (2025): $4,286 · +3.3% YoY. Source: county tax records.
Cash-flow waterfall
monthlySold comps — $/sqft
last 12 mo · ≤1 miLoading sold comps…