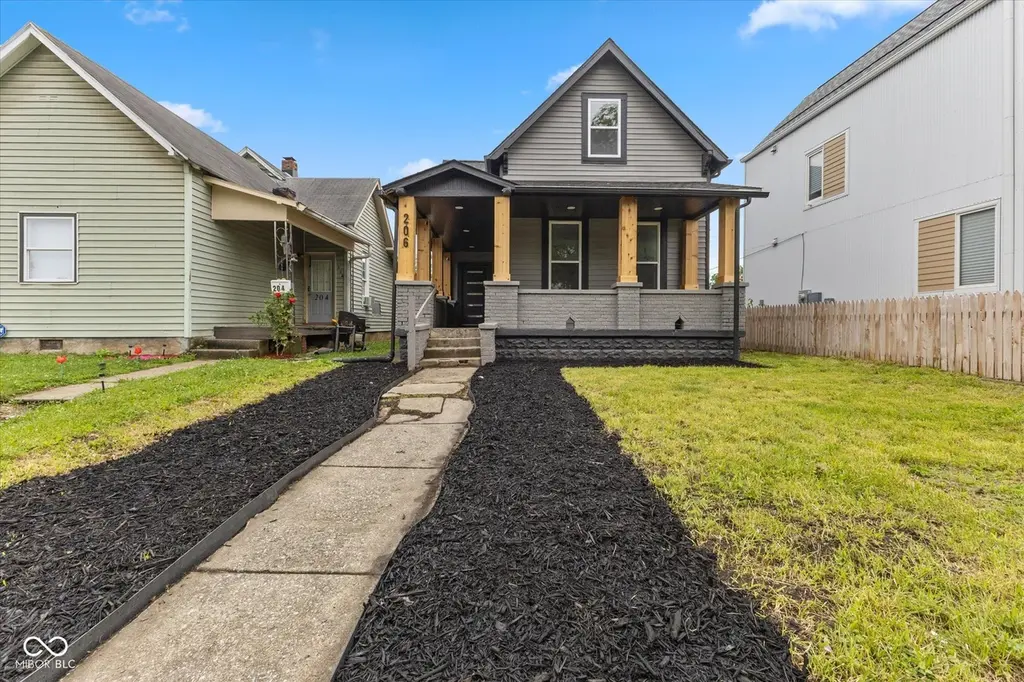
206 N Beville Ave
Indianapolis city (balance), IN 46201
$260,000D
3 bd · 3.0 ba ·
2,672 sqft ·
Built 1955
· SingleFamily
· Pending
· 84 DOM
Cashflow @ list (25.0% down · 7.5%)
Estimated rent
$2,065/mo
Mortgage (P&I)
−$1,363
Tax + insurance
−$439
HOA
−$0
Vac / Maint / Mgmt
−$434
Net cashflow
$-170/mo
Annual
$-2,046/yr
Cap rate
5.51%
Cash-on-cash
-2.81%
DSCR
0.87
1% rule
0.79%
Cash to close
$72,800
Investor read
- This is a 3-bed/3.0-bath single-family listed at $260k.
- At list price, monthly cash flow is $-170 ($-2k/yr) — negative.
- To cash-flow at today's rent, offer at most $230k (11.6% below list).
- To meet the 1% rule (rent ≥ 1% of price), the offer needs to be $207k (20.6% below list).
- It's been on market 84 days — a 6% lower offer ($244k) is reasonable based on typical stale-listing flexibility.
- Recommended offer: $207k (20.6% below list) — sets the bar for 1% rule.
- Local home prices are declining (-3.0%/yr); year-one equity from $2k of loan paydown is wiped out by about $8k of value loss. Plan a longer hold.
- Location reads: area grade D — affects rentability + tenant quality, not the cash-flow math above.
- Indianapolis Public Schools (urban): math 14% / reading 20% proficiency, ranked #286 of 301 in IN (top 95%) — low school quality limits family demand, transient renter base, plan for 1-2y turnover; 77% free/reduced lunch — lower-income household profile, screen leases tightly.
- Watch-outs: built in 1955 — expect roof / HVAC / electrical / plumbing capex.
- Market conditions: Rents rising fast (+7.3%/yr); 480 active listings in the ZIP; 37 comparable units currently listed for rent nearby; rentals at typical pace (median 24d on market — plan ~3-4 weeks tenant-placement turnaround); 1,906 units permitted in Marion County in 2024 (621 in 5+ unit buildings).
- Marion County population projected at +18% by 2050 — long-run rental-demand tailwind backs the buy-and-hold thesis.
- 10 sale attempts since 21y ago with the ask held roughly flat each time — persistent listings suggest the price (not the market) is what's stuck; bring a comps-based counter.
- Current owner paid $106k; list at $260k implies a 146% gain — meaningful room to come down on a strong offer.
- Cap rate 5.5% vs local median 4.4% in Indianapolis city (balance) — meaningfully above typical; check what's discounted (condition, days-on-market, listing class) to confirm the premium yield is real.
- At $2,065/mo this rent would consume 50% of the median local household income ($49k/yr) (locally 1906% of renters already pay >50% of income on rent) — very limited rent-growth headroom before tenants either downsize or default.
Questions for listing agent
- What do current leases actually rent for vs. the listed asking? Can we see a recent rent roll and the last 12 months of T-12 income?
- It's been on market 84 days. Have you received any prior offers? Is the seller open to a 21% concession, seller financing, or rate buy-down credit?
- Built in 1955 — when were the roof, HVAC, electrical panel, plumbing, and water heater last replaced?
- Why hasn't it sold? Are there any deal-killer items the seller is aware of (foundation, flood, title, zoning, code violations)?
- Is there a deadline driving the sale (1031 exchange, divorce, estate, relocation)? That informs how much negotiation room exists.
- The area grade is low — what's the realistic commute time and amenity access for the typical tenant pool here? Any planned neighborhood developments (good or bad) we should know about?
- What's the average days-on-market for RENTAL listings here right now (not sales)? A rising rental-DOM trend means longer vacancies and softer asking-rent achievability than the comps imply.
- What's the recent tenant-quality profile in this submarket — average credit score on applications, eviction rate, late-payment / NSF rate, and stable-employment percentage? A property-management company in the area should have these aggregated.
CashFlowRE · CFR-PQB7CCE6J4R0GF
· Data 2 weeks ago
cashflowre.app · 2026-05-29