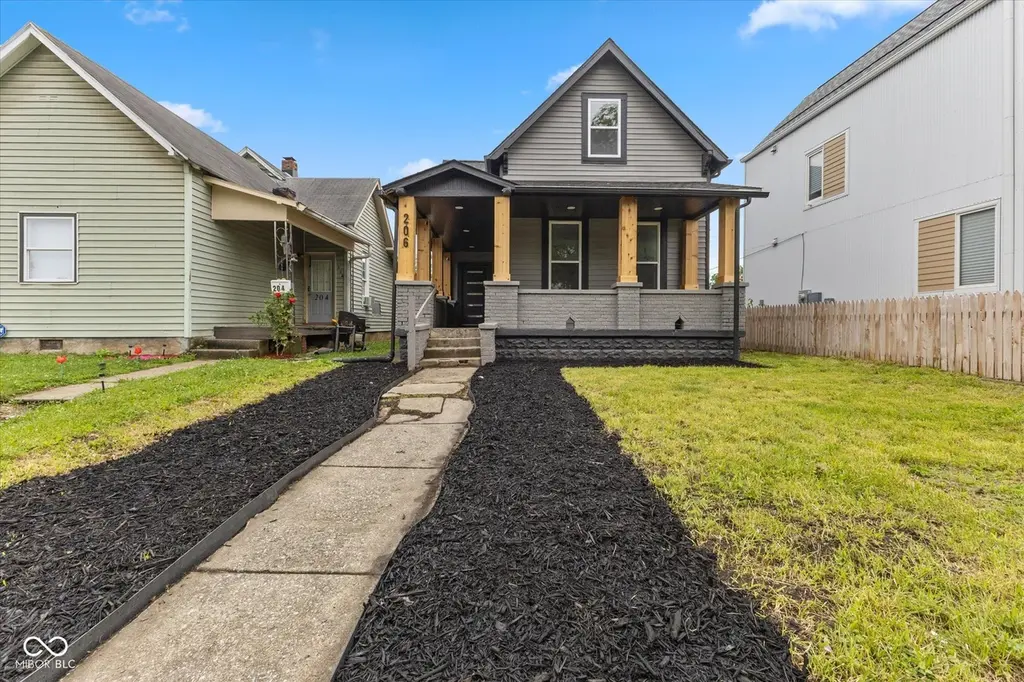
206 N Beville Ave · Indianapolis city (balance), IN
Flood risk 1/10 · Minimal
- FEMA flood zone
- X (unshaded)
- Chance of flooding over 30 yrs
- 0.0%
- Est. flood insurance / yr
- $473 – $860
Fire risk 1/10 · Minimal
- Est. fire insurance / yr
- $717 – $1,331
Heat risk 4/10 · Minor
- Hot days now (above 101°F)
- 7 days/yr
- Hot days in 30 yrs
- 19 days/yr
Wind risk 2/10 · Minimal
- Chance of severe wind over 30 yrs
- 0.0%
Air-quality risk 4/10 · Minor
- Unhealthy air days now
- 5 days/yr
- Unhealthy air days in 30 yrs
- 7 days/yr
Risk factors via First Street. Map © Google.
Why this score? — see what drove the D grade
The composite is a weighted blend of 9 inputs, each scored 0–100. Each bar is that input's sub-score; the figure is the points it added to the 100-point composite (weight × sub-score).
- ARV discount +15.0/15.0
- Cash flow +9.7/30.0
- Rent growth +4.3/5.0
- 1% rule +2.9/10.0
- DSCR +2.7/10.0
- Livability +2.5/5.0
- Condition / age +2.5/5.0
- Schools +1.4/10.0
- Appreciation +0.0/10.0
$260,000
🖨 Deal sheet 📄 Offer letter ✓ Due diligence
Listing remarks MLS
Fully renovated inside and out, this beautifully updated 5 bedroom 3 bath home is located in downtown Indianapolis and is near everything downtown Indy has to offer. Step inside to soaring ceilings and an open-concept layout that flows into a luxury chef's kitchen featuring high-end finishes and a massive island perfect for cooking and entertaining. The primary suite offers a true retreat with a fireplace and a spa-style his-and-hers bathroom featuring a standalone soaking tub. Upstairs includes three additional bedrooms and a full bath, providing ideal separation of space. Outside, enjoy a covered porch with a spacious backyard. Which is surrounded by new construction, in this up and coming neighborhood.
Key facts
- Massive island
- Covered porch
- Spacious backyard
Tags
Neighborhood map
What this means for you Summary
Snapshot
- This is a 3-bed/3.0-bath single-family listed at $260k.
Deal economics
- At list price, monthly cash flow is $-170 ($-2k/yr) — negative.
- To cash-flow at today's rent, offer at most $230k (11.6% below list).
- To meet the 1% rule (rent ≥ 1% of price), the offer needs to be $207k (20.6% below list).
- Recommended offer: $207k (20.6% below list) — sets the bar for 1% rule.
- Cap rate 5.5% vs local median 4.4% in Indianapolis city (balance) — meaningfully above typical; check what's discounted (condition, days-on-market, listing class) to confirm the premium yield is real.
Location & tenants
- Location reads: area grade D — affects rentability + tenant quality, not the cash-flow math above.
- Indianapolis Public Schools (urban): math 14% / reading 20% proficiency, ranked #286 of 301 in IN (top 95%) — low school quality limits family demand, transient renter base, plan for 1-2y turnover; 77% free/reduced lunch — lower-income household profile, screen leases tightly.
- Market conditions: Rents rising fast (+7.3%/yr); 480 active listings in the ZIP; 37 comparable units currently listed for rent nearby; rentals at typical pace (median 24d on market — plan ~3-4 weeks tenant-placement turnaround); 1,906 units permitted in Marion County in 2024 (621 in 5+ unit buildings).
- At $2,065/mo this rent would consume 50% of the median local household income ($49k/yr) (locally 1906% of renters already pay >50% of income on rent) — very limited rent-growth headroom before tenants either downsize or default.
Forward outlook
- Local home prices are declining (-3.0%/yr); year-one equity from $2k of loan paydown is wiped out by about $8k of value loss. Plan a longer hold.
- Marion County population projected at +18% by 2050 — long-run rental-demand tailwind backs the buy-and-hold thesis.
Negotiation context
- It's been on market 84 days — a 6% lower offer ($244k) is reasonable based on typical stale-listing flexibility.
- 10 sale attempts since 21y ago with the ask held roughly flat each time — persistent listings suggest the price (not the market) is what's stuck; bring a comps-based counter.
- Current owner paid $106k; list at $260k implies a 146% gain — meaningful room to come down on a strong offer.
Risks & watch-outs
- Watch-outs: built in 1955 — expect roof / HVAC / electrical / plumbing capex.
Questions for the listing agent
- What do current leases actually rent for vs. the listed asking? Can we see a recent rent roll and the last 12 months of T-12 income?
- It's been on market 84 days. Have you received any prior offers? Is the seller open to a 21% concession, seller financing, or rate buy-down credit?
- Built in 1955 — when were the roof, HVAC, electrical panel, plumbing, and water heater last replaced?
- Why hasn't it sold? Are there any deal-killer items the seller is aware of (foundation, flood, title, zoning, code violations)?
- Is there a deadline driving the sale (1031 exchange, divorce, estate, relocation)? That informs how much negotiation room exists.
- The area grade is low — what's the realistic commute time and amenity access for the typical tenant pool here? Any planned neighborhood developments (good or bad) we should know about?
- What's the average days-on-market for RENTAL listings here right now (not sales)? A rising rental-DOM trend means longer vacancies and softer asking-rent achievability than the comps imply.
- What's the recent tenant-quality profile in this submarket — average credit score on applications, eviction rate, late-payment / NSF rate, and stable-employment percentage? A property-management company in the area should have these aggregated.
- How much new for-sale + rental construction is in the pipeline within 1–3 miles? Heavy new supply typically softens prices + rents 12–24 months out; constrained supply supports both.
Investment metrics
- 1% rule
- 0.79% ✗
- Cap rate
- 5.51%
- Cash-on-cash
- -2.81%
- DSCR
- 0.87
- GRM
- 10.5
CMA / ARV
- ARV (median comp)
- $324,221
- List price
- $260,000
- Delta
- -19.81%
- Verdict
- UNDERPRICED
- Comps
- 20 within 1.0 mi
Show comp detail 12 sales within ~0.75 mi
| Address | Dist | Beds/Ba | Sqft | Sold | Price | $/sf | Match |
|---|---|---|---|---|---|---|---|
| 206 N Randolph St | 0.29mi | 3/2.5 | 2,613 (-2%) | 1mo | $269,000 | $103 | 80 |
| 622 N Hamilton Ave | 0.51mi | 3/3.5 | 2,717 (+2%) | 2mo | $430,000 | $158 | 70 |
| 626 N Hamilton Ave | 0.52mi | 3/2.5 | 2,580 (-3%) | 1mo | $470,000 | $182 | 67 |
| 1409 E New York St | 0.62mi | 3/2.0 | 2,724 (+2%) | 1mo | $405,000 | $149 | 63 |
| 353 N Arsenal Ave | 0.55mi | 3/3.5 | 2,496 (-7%) | 2mo | $585,600 | $235 | 60 |
| 519 Woodruff Place Middle Dr | 0.42mi | 3/3.0 | 2,349 (-12%) | 0mo | $420,000 | $179 | 60 |
| 528 N Beville Ave | 0.38mi | 3/2.5 | 2,322 (-13%) | 1mo | $380,000 | $164 | 58 |
| 43 N Walcott St | 0.32mi | 3/2.0 | 2,296 (-14%) | 1mo | $350,000 | $152 | 57 |
| 545 N Hamilton Ave | 0.43mi | 4/2.5 (+1) | 2,942 (+10%) | 0mo | $350,000 | $119 | 56 |
| 1205 E Vermont St | 0.73mi | 3/2.0 | 2,802 (+5%) | 2mo | $310,000 | $111 | 52 |
| 1214 E New York St | 0.72mi | 3/2.5 | 2,856 (+7%) | 1mo | $540,000 | $189 | 52 |
| 916 N Tacoma Ave | 0.72mi | 3/3.0 | 2,918 (+9%) | 0mo | $350,000 | $120 | 51 |
Match score weights: distance 35% · size 25% · config 20% · recency 20%. Top-matched comps best support the ARV.
Projected returns pro-forma
-3.0% appreciation · 7.31% rent growth · sell at horizon
- IRR
- -16.3%
- Equity multiple
- 0.40×
- Total profit
- $-43,610
- Equity at exit
- $38,767
- IRR
- -1.7%
- Equity multiple
- 0.86×
- Total profit
- $-9,898
- Equity at exit
- $22,480
Cash invested: $72,800 (down + closing). Projections, not guarantees.
Landlord ↔ Tenant lean methodology
- Overall (STATE)
- 90 Strongly Landlord-Friendly
- State Indiana
- 90 Strongly Landlord-Friendly · R+11
- County
- — inherits STATE
- City
- — inherits STATE
ZIP-level market 46201
- Home prices YoY
- -33.9%
- Rents YoY
- 7.3%
- Active inventory
- 480
- Price-to-rent
- 10.5×
Monthly cashflow live
- Estimated rent
- $2,065 high interval (Pro) →
- Mortgage (P&I)
- −$1,363
- Tax from tax record
- −$330 /mo · $3,963/yr
- Insurance
- −$108
- HOA
- −$0
- Vacancy / Maint / Mgmt
- −$434
- Net cashflow
- $-170
Break-even live
UW: 25.0% down · 7.5% · 30yr · 1.5% tax · 5.0% vac · 8.0% maint · 8.0% mgmt
Financing live
Cash to close
- Down payment
- $65,000
- Closing costs
- $7,800
- Reserves months
- —
- Total cash needed
- —
Loan-product check · same deal, 3 products live
Conventional
25% down · 7.5% · 30yr
- Down + closing
- —
- Monthly P&I
- —
- Monthly cashflow
- —
- DSCR
- —
- Eligible?
- —
Personal DTI + credit; lowest rate.
DSCR
20% down · 8.5% · 30yr
- Down + closing
- —
- Monthly P&I
- —
- Monthly cashflow
- —
- DSCR
- —
- Eligible?
- —
No personal income docs; deal must DSCR.
Hard money
10% down · 12.0% · 12mo
- Down + closing
- —
- Monthly P&I
- —
- Monthly cashflow
- —
- DSCR
- —
- Eligible?
- —
Short-term bridge; refi at stabilization.
Rent comps 37 comps
| Address | Beds | Baths | Sqft | Rent | $/sqft | DOM | Units | Dist |
|---|---|---|---|---|---|---|---|---|
| 210 N Keystone Ave Indianapolis, IN | 4.0 | 2.0 | 2024 | $2,200 | $1.09 | 7d | 1 | 0.05mi |
| 238 Eastern Ave Indianapolis, IN | 3.0 | 2.0 | 1850 | $1,900 | $1.03 | 23d | 1 | 0.28mi |
| 17 N Randolph St Indianapolis, IN | 3.0 | 2.0 | 1822 | $2,075 | $1.14 | 4d | 1 | 0.30mi |
| 409 N Temple Ave Indianapolis, IN | 3.0 | 2.0 | 2106 | $1,650 | $0.78 | 43d | 1 | 0.32mi |
| 420 Eastern Ave Indianapolis, IN | 3.0 | 1.0 | 1900 | $1,325 | $0.70 | 43d | 1 | 0.36mi |
| 29 N Walcott St Indianapolis, IN | 4.0 | 3.0 | 2200 | $2,400 | $1.09 | 43d | 1 | 0.42mi |
| 2822 E Michigan St Indianapolis, IN | 3.0 | 2.0 | 1918 | $1,999 | $1.04 | 21d | 1 | 0.50mi |
| 322 N Summit St Unit 4 Indianapolis, IN | 3.0 | 3.5 | 2546 | $3,100 | $1.22 | 7d | 1 | 0.51mi |
| 1531 Sturm Ave Indianapolis, IN | 3.0 | 2.0 | 1806 | $1,515 | $0.84 | 23d | 1 | 0.53mi |
| 1529 Sturm Ave Indianapolis, IN | 3.0 | 2.0 | 1806 | $1,515 | $0.84 | 23d | 1 | 0.53mi |
| 656 N Beville Ave Indianapolis, IN | 3.0 | 2.5 | 2121 | $3,500 | $1.65 | 23d | 1 | 0.54mi |
| 1430 E Ohio St Indianapolis, IN | 3.0 | 1.5 | 2174 | $1,745 | $0.80 | 43d | 1 | 0.59mi |
| 117 S Arsenal Ave Indianapolis, IN | 3.0 | 2.0 | 2592 | $1,800 | $0.69 | 43d | 1 | 0.63mi |
| 1223 E New York St Indianapolis, IN | 3.0 | 3.0 | 2154 | $2,300 | $1.07 | 4d | 1 | 0.71mi |
| 49 S Lasalle St Unit 1540092P Indianapolis, IN | 3.0 | 2.0 | 1991 | $3,053 | $1.53 | 3d | 1 | 0.75mi |
| 1643 Fletcher Ave Indianapolis, IN | 3.0 | 2.0 | 2019 | $2,249 | $1.11 | 23d | 1 | 0.95mi |
| 1613 Fletcher Ave Indianapolis, IN | 2.0 | 1.0 | 2208 | $2,149 | $0.97 | 23d | 1 | 0.97mi |
| 931 N Lasalle St Indianapolis, IN | 4.0 | 2.5 | 2544 | $2,300 | $0.90 | 43d | 1 | 1.00mi |
| 1226 N Beville Ave Indianapolis, IN | 3.0 | 2.5 | 3273 | $4,129 | $1.26 | 23d | 1 | 1.01mi |
| 2201 Pleasant St Indianapolis, IN | 4.0 | 3.0 | 2063 | $2,495 | $1.21 | 4d | 1 | 1.04mi |
| 3712 E Market St Indianapolis, IN | 3.0 | 1.0 | 1800 | $1,450 | $0.81 | 14d | 1 | 1.05mi |
| 1548 Lexington Ave Indianapolis, IN | 4.0 | 3.0 | 2224 | $2,250 | $1.01 | 3d | 1 | 1.07mi |
| 1135 Spann Ave Indianapolis, IN | 4.0 | 2.5 | 1836 | $2,495 | $1.36 | 17d | 1 | 1.15mi |
| 519 Fulton St Indianapolis, IN | 3.0 | 2.5 | 1830 | $6,000 | $3.28 | 43d | 1 | 1.16mi |
| 1140 Hoyt Ave Indianapolis, IN | 4.0 | 1.5 | 1831 | $1,895 | $1.03 | 43d | 1 | 1.22mi |
| 890 Massachusetts Ave Unit 1014223P Indianapolis, IN | 3.0 | 3.0 | 1991 | $5,540 | $2.78 | 2d | 1 | 1.24mi |
| 2418 E 16th St Indianapolis, IN | 2.0 | 1.5 | 1863 | $2,125 | $1.14 | 23d | 1 | 1.26mi |
| 1153 Villa Ave Indianapolis, IN | 4.0 | 2.0 | 2880 | $2,100 | $0.73 | 23d | 1 | 1.32mi |
| 706 Massachusetts Ave Indianapolis, IN | 2.0 | 2.5 | 1908 | $2,700 | $1.42 | 11d | 1 | 1.36mi |
| 1441 Prospect St Indianapolis, IN | 2.0 | 1.0–2.0 | 2840 | $2,000 | $0.70 | 1d | 13 | 1.37mi |
| 2536 E 17th St Indianapolis, IN | 2.0 | 2.0 | 2086 | $1,450 | $0.70 | 4d | 1 | 1.38mi |
| 1230 Harlan St Indianapolis, IN | 3.0 | 3.5 | 2167 | $2,600 | $1.20 | 1d | 1 | 1.38mi |
| 1027 Hosbrook St Indianapolis, IN | 4.0 | 3.5 | 3612 | $4,750 | $1.32 | 17d | 1 | 1.44mi |
| 1706 Ingram St Indianapolis, IN | 3.0 | 2.0 | 2592 | $2,000 | $0.77 | 7d | 1 | 1.44mi |
| 800 N Park Ave Indianapolis, IN | 2.0 | 2.0 | 2101 | $2,000 | $0.95 | 21d | 1 | 1.45mi |
| 323 N Gladstone Ave Indianapolis, IN | 3.0 | 2.0 | 2580 | $1,285 | $0.50 | 43d | 1 | 1.45mi |
| 325 N Gladstone Ave Indianapolis, IN | 3.0 | 2.0 | 2580 | $1,285 | $0.50 | 43d | 1 | 1.45mi |
Listing history 35 events
-
2026-06-02status $260,000 Pending 84 DOM
-
2026-06-01days on market $260,000 Active 84 DOM
-
2026-05-31days on market $260,000 Active 83 DOM
-
2026-04-06price $260,000 734-char remark
Show marketing remark (734 chars)
Fully renovated inside and out, this beautifully updated 5 bedroom 3 bath home is located in downtown Indianapolis and is near everything downtown Indy has to offer. Step inside to soaring ceilings and an open-concept layout that flows into a luxury chef's kitchen featuring high-end finishes and a massive island perfect for cooking and entertaining. The primary suite offers a true retreat with a fireplace and a spa-style his-and-hers bathroom featuring a standalone soaking tub. Upstairs includes three additional bedrooms and a full bath, providing ideal separation of space. Outside, enjoy a covered porch with a spacious backyard. Which is surrounded by new construction, in this up and coming neighborhood.
-
2026-03-07$270,000 Active 734-char remark
Show marketing remark (734 chars)
Fully renovated inside and out, this beautifully updated 5 bedroom 3 bath home is located in downtown Indianapolis and is near everything downtown Indy has to offer. Step inside to soaring ceilings and an open-concept layout that flows into a luxury chef's kitchen featuring high-end finishes and a massive island perfect for cooking and entertaining. The primary suite offers a true retreat with a fireplace and a spa-style his-and-hers bathroom featuring a standalone soaking tub. Upstairs includes three additional bedrooms and a full bath, providing ideal separation of space. Outside, enjoy a covered porch with a spacious backyard. Which is surrounded by new construction, in this up and coming neighborhood.
-
2026-01-25historical
-
2026-01-22price $260,000
-
2025-11-11price $270,000
-
2025-10-08price $275,000
-
2025-09-23status Active
-
2025-09-23historical
-
2025-09-22$285,000 Active
-
2025-09-16historical
-
2025-08-18price $295,000
-
2025-07-31price $300,000
-
2025-07-22price $307,000
-
2025-07-11price $315,000
-
2025-06-30price $325,000
-
2025-06-18$335,000 Active
-
2024-09-26soldstatus $105,500 Closed
-
2024-08-05status Pending
-
2024-08-02status Active
-
2024-08-01status Pending
-
2024-07-26$120,000 Active
-
2021-12-01soldstatus $160,000 Closed
-
2021-11-19historical
-
2021-11-19$160,000
-
2019-05-08historical
-
2018-10-29$94,000 Active
-
2018-01-05soldstatus $46,000 Sold
-
2017-05-19status Pending
-
2017-04-05price $49,900
-
2016-08-19$51,900 Active
-
2006-12-28historical
-
2005-12-29$59,900
ⓘ Source: listings_history table (triggers on properties + properties_extension) + one-shot
backfill from property_details.listing_events for pre-trigger history.
Tax reassessment forecast IN · Partial reset (capped growth)
- Current annual tax
- $3,963 · $330/mo
- Projected year-2 tax
- $3,963 · $330/mo
- Expected delta
- $0/yr ($0/mo · 0.0%)
ⓘ Screening estimate from a state-policy table — verify with the county assessor before closing.
Climate risk First Street
- Flood 1/10 Low FEMA zone X (unshaded) · 0% chance over 30 yrs
- Wildfire 1/10 Low
- Heat 4/10 Moderate 7 d/yr ≥101°F today · 19 d/yr by 30 yrs out
- Wind 2/10 Low 0% chance of damaging wind over 30 yrs
- Air quality 4/10 Moderate 5 unhealthy d/yr today · 7 by 30 yrs out
Nearby sold comps map
Loading sold comps map…
Walkable amenities ~0.75 mi
Loading nearby amenities…
Taxation est. · year 1
- Rental income
- $24,784
- − Mortgage interest
- −$14,564
- − Property taxes
- −$3,963
- − Insurance
- −$1,300
- − Repairs & maintenance
- −$1,983
- − Management
- −$1,983
- − Depreciation
- −$7,564
- Taxable loss
- −$6,573
- Est. tax savings @ 24.0%
- +$1,577
- After-tax cash flow
- $-468/yr
For passive investors: Depreciation is non-cash, so a rental often shows a tax loss while cash-flowing — sheltering income. Rental losses are passive: they offset passive income freely, and up to $25,000/yr can offset ordinary (W-2) income if you actively participate and your MAGI is under $100k (phasing out to $0 by $150k); unused losses carry forward. On sale, claimed depreciation is recaptured at up to 25%, and gains may owe capital-gains tax (a 1031 exchange can defer both). Figures are a year-1 estimate at your 24.0% rate — not tax advice; consult a CPA.
Schools (NCES district)
- District
- Indianapolis Public Schools
- NCES district ID
- 1804770
- Math proficiency
- 14% ▼ -7.00%
- Reading proficiency
- 20% ▼ -3.00%
- Median HH income
- $32,034
- Composite
- 13.69/100
- National rank
- #9499
- State rank
- #286 of 301 in IN
Livability — Indianapolis city (balance)
No livability data for this city. (Only ~50 U.S. cities are tracked.)
Census & demographics
- Census place
- Indianapolis city (balance), IN
- County
- Marion County · 998,460 people
- City population
- 881,119
- Metro
- Indianapolis-Carmel-Anderson, IN
- Population (ZIP)
- 30,335
- Household income
- $49,195
- Rent vs Own
- Severe rent burden
- 1906.0
Population outlook (Marion County) Hauer SSP2
- Today (2025)
- 1,025,572 people
- By 2030
- 1,065,727 · +3.9%
- By 2040
- 1,141,577 · +11.3%
- By 2050
- 1,208,920 · +17.9%
- By 2075
- 1,367,288 · +33.3%
- By 2100
- 1,438,201 · +40.2%
Race, ethnicity, and origin ACS 2023
- Neighborhood character
- Diverse neighborhood (Simpson 0.63)
- Race & ethnicity
- White 53% Hispanic / Latino 23% Black 18% Two or more races 9%
- Hispanic origin (detail)
- Mexican 14% Puerto Rican 2%
- Common ancestry
- Slovak 2% Lithuanian 2% Italian 1%
- Foreign-born
- 9% · Canada
- Languages at home
- 81% English-only · Spanish 17%
Political lean MEDSL · Marion
- 2024 margin
- Strong D (+27.7) · D 63.0% · R 35.3% · Other 1.7%
- 2008→2024 swing
- -0.7pp no change · 2008: 28.4pp · 2024: 27.7pp
- All cycles
- 2024: D+27.7 2020: D+29.1 2016: D+22.8 2012: D+22.2 2008: D+28.4
Not yet ingested
- Civics
- —
Market trends
- HPI YoY
- ▼ -192.51%
- Current HPI
- 375.0969
- Rent YoY
- ▲ 7.31%
- Metro
- Indianapolis-Carmel-Anderson, IN
- State GDP YoY
- ▲ 2.90%
- F500 in state
- 18
Industry mix (Fortune 500 HQ in IN)
| Industry | F500 HQs | Revenue |
|---|---|---|
| Industrial Machinery | 2 | $37B |
|
||
| Healthcare | 1 | $177B |
|
||
| Pharmaceuticals | 1 | $45B |
|
||
| Metals / Steel | 1 | $18B |
|
||
| Agriculture | 1 | $17B |
|
||
| Packaging | 1 | $12B |
|
||
Price history
+334.1% since first listed32 events — show timeline
- 2026-04-06 Price Changed $260,000 MIBOR as Distributed by MLS Grid
- 2026-03-07 Listed $270,000 MIBOR as Distributed by MLS Grid
- 2026-01-25 Listing Removed — MIBOR as Distributed by MLS Grid
- 2026-01-22 Price Changed $260,000 MIBOR as Distributed by MLS Grid
- 2025-11-11 Price Changed $270,000 MIBOR as Distributed by MLS Grid
- 2025-10-08 Price Changed $275,000 MIBOR as Distributed by MLS Grid
- 2025-09-23 Relisted — MIBOR as Distributed by MLS Grid
- 2025-09-23 Listing Removed — MIBOR as Distributed by MLS Grid
- 2025-09-22 Listed $285,000 MIBOR as Distributed by MLS Grid
- 2025-09-16 Listing Removed — MIBOR as Distributed by MLS Grid
- 2025-08-18 Price Changed $295,000 MIBOR as Distributed by MLS Grid
- 2025-07-31 Price Changed $300,000 MIBOR as Distributed by MLS Grid
- 2025-07-22 Price Changed $307,000 MIBOR as Distributed by MLS Grid
- 2025-07-11 Price Changed $315,000 MIBOR as Distributed by MLS Grid
- 2025-06-30 Price Changed $325,000 MIBOR as Distributed by MLS Grid
- 2025-06-18 Listed $335,000 MIBOR as Distributed by MLS Grid
- 2024-09-26 Sold (MLS) $105,500 MIBOR as Distributed by MLS Grid
- 2024-08-05 Pending — MIBOR as Distributed by MLS Grid
- 2024-08-02 Relisted — MIBOR as Distributed by MLS Grid
- 2024-08-01 Pending — MIBOR as Distributed by MLS Grid
- 2024-07-26 Listed $120,000 MIBOR as Distributed by MLS Grid
- 2021-12-01 Sold (MLS) $160,000 MIBOR as Distributed by MLS Grid
- 2021-11-19 Listed $160,000 MIBOR as Distributed by MLS Grid
- 2021-11-19 Listing Removed — MIBOR as Distributed by MLS Grid
- 2019-05-08 Listing Removed — MIBOR as Distributed by MLS Grid
- 2018-10-29 Listed $94,000 MIBOR as Distributed by MLS Grid
- 2018-01-05 Sold (MLS) $46,000 MIBOR as Distributed by MLS Grid
- 2017-05-19 Pending — MIBOR as Distributed by MLS Grid
- 2017-04-05 Price Changed $49,900 MIBOR as Distributed by MLS Grid
- 2016-08-19 Listed $51,900 MIBOR as Distributed by MLS Grid
- 2006-12-28 Listing Removed — MIBOR as Distributed by MLS Grid
- 2005-12-29 Listed $59,900 MIBOR as Distributed by MLS Grid
Property tax history
+19.2%/yrLatest (2025): $3,963 · -5.2% YoY. Source: county tax records.
Cash-flow waterfall
monthlySold comps — $/sqft
last 12 mo · ≤1 miLoading sold comps…