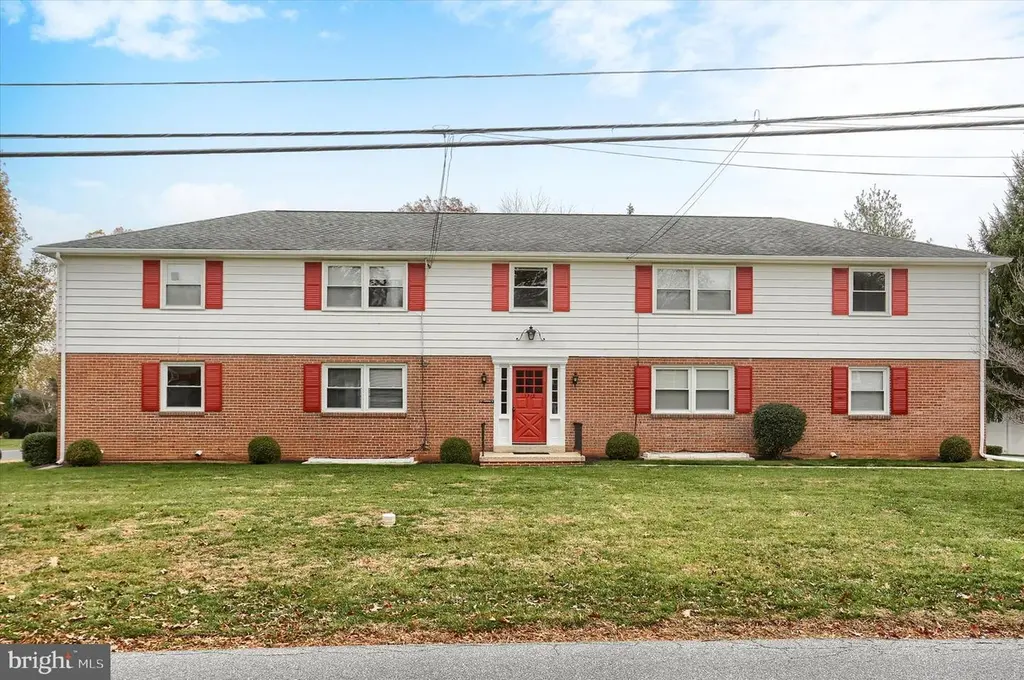
1515 Esbenshade Rd
Lancaster, PA 17601
$1,300,000B-
60 bd · 36.0 ba ·
6,192 sqft ·
Built 1963
· MultiFamily
· Pending
· 166 DOM
Cashflow @ list (25.0% down · 7.5%)
Estimated rent
$14,568/mo
Mortgage (P&I)
−$6,817
Tax + insurance
−$1,085
HOA
−$0
Vac / Maint / Mgmt
−$3,059
Net cashflow
$3,606/mo
Annual
$43,271/yr
Cap rate
9.62%
Cash-on-cash
11.89%
DSCR
1.53
1% rule
1.12%
Cash to close
$364,000
Investor read
- This is a 6 × 10-bed/6.0-bath units multifamily listed at $1.30M.
- At list price, monthly cash flow is $4k ($43k/yr) — positive. Per door: $601/mo.
- The deal already cash-flows at list — no discount required.
- Meets the 1% rule at list price ($15k rent vs $1.30M).
- It's been on market 166 days — a 12% lower offer ($1.14M) is reasonable based on typical stale-listing flexibility.
- Recommended offer: $1.14M (12.0% below list) — sets the bar for market timing.
- Local home prices are declining (-3.0%/yr); year-one equity from $9k of loan paydown is wiped out by about $39k of value loss. Plan a longer hold.
- Location reads 85/100 on livability (#71 in PA, #498 nationally) — a professional / high-income tenant draw. Strengths: amenities A+, commute A+, cost of living A+; Watch: crime C-, employment C-.
- Manheim Township SD (suburban): math 53% / reading 68% proficiency, ranked #61 of 539 in PA (top 11%) — acceptable for families but not a draw, mixed tenant base, ~2y average lease.
- Market conditions: Rents rising (+4.0%/yr); 321 active listings in the ZIP; solid renter incomes; 1,093 units permitted in Lancaster County in 2024 (201 in 5+ unit buildings).
- Lancaster County population projected at +5% by 2050 — modest demand growth; plan on rents tracking national, not racing it.
- 4 sale attempts; this cycle's ask is 81150% above the opening price — seller raised mid-cycle; expect resistance to lowballs.
- Current owner paid $166k; list at $1.30M implies a 683% gain — meaningful room to come down on a strong offer.
- At projected returns (-3.0% appreciation + 4.0% rent growth), your $364k cash investment doubles in ~9 years — after that, you're playing with house money.
- Climate carrying-cost: extreme-heat days projected 7→15/yr by 2055 (HVAC capex compounding) — expect insurance premiums to compound above CPI over the hold.
- Cap rate 9.6% vs local median 4.2% in Lancaster — top-decile yield for the area; either an underpriced asset or a hidden risk that comps aren't pricing in. Stress-test before assuming the spread holds.
- At $14,568/mo this rent would consume 171% of the median local household income ($102k/yr) (locally 1296% of renters already pay >50% of income on rent) — very limited rent-growth headroom before tenants either downsize or default.
Questions for listing agent
- It's been on market 166 days. Have you received any prior offers? Is the seller open to a 12% concession, seller financing, or rate buy-down credit?
- Can we see the unit-by-unit rent roll, current vacancy, and any below-market leases? What's the average tenancy length?
- What capital expenditures (roof, boiler, parking lot, exteriors) have been made in the last 5 years, and what's planned in the next 2?
- Built in 1963 — when were the roof, HVAC, electrical panel, plumbing, and water heater last replaced?
- Why hasn't it sold? Are there any deal-killer items the seller is aware of (foundation, flood, title, zoning, code violations)?
- Is there a deadline driving the sale (1031 exchange, divorce, estate, relocation)? That informs how much negotiation room exists.
- What's the average days-on-market for RENTAL listings here right now (not sales)? A rising rental-DOM trend means longer vacancies and softer asking-rent achievability than the comps imply.
- What's the recent tenant-quality profile in this submarket — average credit score on applications, eviction rate, late-payment / NSF rate, and stable-employment percentage? A property-management company in the area should have these aggregated.
CashFlowRE · CFR-PQFXMJ78PZ4WEH
· Data 3 weeks ago
cashflowre.app · 2026-05-29