 6-Plex
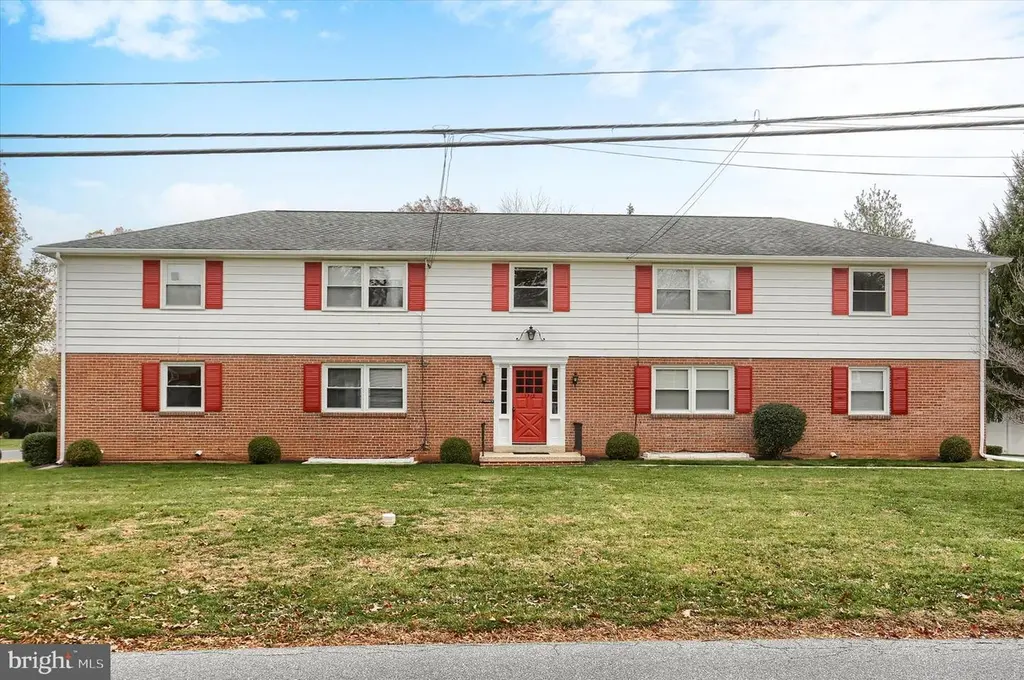
1515 Esbenshade Rd · Lancaster, PA
Flood risk 1/10 · Minimal
- FEMA flood zone
- X (unshaded)
- Chance of flooding over 30 yrs
- 0.0%
- Est. flood insurance / yr
- $507 – $1,088
Fire risk 1/10 · Minimal
- Est. fire insurance / yr
- $511 – $949
Heat risk 6/10 · Moderate
- Hot days now (above 101°F)
- 7 days/yr
- Hot days in 30 yrs
- 15 days/yr
Wind risk 4/10 · Minor
- Chance of severe wind over 30 yrs
- 16.0%
Air-quality risk 4/10 · Minor
- Unhealthy air days now
- 4 days/yr
- Unhealthy air days in 30 yrs
- 6 days/yr
Risk factors via First Street. Map © Google.
Why this score? — see what drove the B- grade
The composite is a weighted blend of 9 inputs, each scored 0–100. Each bar is that input's sub-score; the figure is the points it added to the 100-point composite (weight × sub-score).
- Cash flow +26.9/30.0
- DSCR +9.3/10.0
- ARV discount +7.5/15.0
- 1% rule +6.2/10.0
- Schools +5.3/10.0
- Livability +4.2/5.0
- Rent growth +3.5/5.0
- Condition / age +2.5/5.0
- Appreciation +0.0/10.0
$1,300,000
🖨 Deal sheet 📄 Offer letter ✓ Due diligence
Multi-family units
County records classify this as Multi-Family (5+ Unit). Listing-text estimate: 6 units. confirmed
5+ unit building — per-unit beds/baths from public records are typically unavailable; the breakdown below (if shown) is an estimate from the listing text.
Listing remarks MLS
Discover a reliable investment property at 1515 Esbenshade Rd in Manheim Township, just minutes from Lancaster City. This building was constructed as a multifamily property and is fully leased. All six units are in excellent condition, with updated interiors and well-maintained systems. The common areas are clean, the building is orderly, and the property has been consistently cared for. The current tenant base is stable and includes an on-site coin-operated laundry. The building’s condition helps keep maintenance needs and turnover low. The location offers strong rental demand, with easy access to major roads, local employers, shopping, and Lancaster City amenities. Investors benefit from reliable occupancy and predictable rental income. If you want a turnkey property with documented upkeep and solid performance, 1515 Esbenshade Rd is a straightforward, low-maintenance addition to any portfolio.
Key facts
- Fully leased
- Multifamily property
- Investment property
Tags
Neighborhood map
What this means for you Summary
Snapshot
- This is a 6 × 10-bed/6.0-bath units multifamily listed at $1.30M.
Deal economics
- At list price, monthly cash flow is $4k ($43k/yr) — positive. Per door: $601/mo.
- The deal already cash-flows at list — no discount required.
- Meets the 1% rule at list price ($15k rent vs $1.30M).
- Recommended offer: $1.14M (12.0% below list) — sets the bar for market timing.
- Cap rate 9.6% vs local median 4.2% in Lancaster — top-decile yield for the area; either an underpriced asset or a hidden risk that comps aren't pricing in. Stress-test before assuming the spread holds.
Location & tenants
- Location reads 85/100 on livability (#71 in PA, #498 nationally) — a professional / high-income tenant draw. Strengths: amenities A+, commute A+, cost of living A+; Watch: crime C-, employment C-.
- Manheim Township SD (suburban): math 53% / reading 68% proficiency, ranked #61 of 539 in PA (top 11%) — acceptable for families but not a draw, mixed tenant base, ~2y average lease.
- Market conditions: Rents rising (+4.0%/yr); 321 active listings in the ZIP; solid renter incomes; 1,093 units permitted in Lancaster County in 2024 (201 in 5+ unit buildings).
- At $14,568/mo this rent would consume 171% of the median local household income ($102k/yr) (locally 1296% of renters already pay >50% of income on rent) — very limited rent-growth headroom before tenants either downsize or default.
Forward outlook
- Local home prices are declining (-3.0%/yr); year-one equity from $9k of loan paydown is wiped out by about $39k of value loss. Plan a longer hold.
- Lancaster County population projected at +5% by 2050 — modest demand growth; plan on rents tracking national, not racing it.
- At projected returns (-3.0% appreciation + 4.0% rent growth), your $364k cash investment doubles in ~9 years — after that, you're playing with house money.
Negotiation context
- It's been on market 166 days — a 12% lower offer ($1.14M) is reasonable based on typical stale-listing flexibility.
- 4 sale attempts; this cycle's ask is 81150% above the opening price — seller raised mid-cycle; expect resistance to lowballs.
- Current owner paid $166k; list at $1.30M implies a 683% gain — meaningful room to come down on a strong offer.
Risks & watch-outs
- Climate carrying-cost: extreme-heat days projected 7→15/yr by 2055 (HVAC capex compounding) — expect insurance premiums to compound above CPI over the hold.
Questions for the listing agent
- It's been on market 166 days. Have you received any prior offers? Is the seller open to a 12% concession, seller financing, or rate buy-down credit?
- Can we see the unit-by-unit rent roll, current vacancy, and any below-market leases? What's the average tenancy length?
- What capital expenditures (roof, boiler, parking lot, exteriors) have been made in the last 5 years, and what's planned in the next 2?
- Built in 1963 — when were the roof, HVAC, electrical panel, plumbing, and water heater last replaced?
- Why hasn't it sold? Are there any deal-killer items the seller is aware of (foundation, flood, title, zoning, code violations)?
- Is there a deadline driving the sale (1031 exchange, divorce, estate, relocation)? That informs how much negotiation room exists.
- What's the average days-on-market for RENTAL listings here right now (not sales)? A rising rental-DOM trend means longer vacancies and softer asking-rent achievability than the comps imply.
- What's the recent tenant-quality profile in this submarket — average credit score on applications, eviction rate, late-payment / NSF rate, and stable-employment percentage? A property-management company in the area should have these aggregated.
- How much new apartment / multifamily construction is in the pipeline within 1–3 miles? Heavy new supply (>2% of stock underway) typically softens rents 12–24 months out; light construction supports rent growth.
Investment metrics
- 1% rule
- 1.12% ✓
- Cap rate
- 9.62%
- Cash-on-cash
- 11.89%
- DSCR
- 1.53
- GRM
- 7.4
CMA / ARV
- ARV (median comp)
- $479,943
- List price
- $1,300,000
- Delta
- 170.87%
- Verdict
- OVERPRICED
- Comps
- 3 within 1.0 mi
Projected returns pro-forma
-3.0% appreciation · 3.99% rent growth · sell at horizon
- IRR
- 2.4%
- Equity multiple
- 1.09×
- Total profit
- $33,216
- Equity at exit
- $193,834
- IRR
- 12.8%
- Equity multiple
- 2.06×
- Total profit
- $384,201
- Equity at exit
- $112,400
Cash invested: $364,000 (down + closing). Projections, not guarantees.
Landlord ↔ Tenant lean methodology
- Overall (STATE)
- 62 Landlord-Friendly
- State Pennsylvania
- 62 Landlord-Friendly · EVEN
- County
- — inherits STATE
- City
- — inherits STATE
ZIP-level market 17601
- Rents YoY
- 4.0%
- Active inventory
- 321
- Price-to-rent
- 44.6×
Monthly cashflow live
- Estimated rent
- $14,568 medium interval (Pro) →
- Mortgage (P&I)
- −$6,817
- Tax from tax record
- −$544 /mo · $6,526/yr
- Insurance
- −$542
- HOA
- −$0
- Vacancy / Maint / Mgmt
- −$3,059
- Net cashflow
- $3,606
Break-even live
6-unit breakdown (identical units grouped — click to expand)
| Units | Beds | Baths | Est. rent |
|---|---|---|---|
| 6× units | 10 | 6 | $14,568 |
| #1 | 10 | 6 | $2,428 |
| #2 | 10 | 6 | $2,428 |
| #3 | 10 | 6 | $2,428 |
| #4 | 10 | 6 | $2,428 |
| #5 | 10 | 6 | $2,428 |
| #6 | 10 | 6 | $2,428 |
| Total (6 units) | $14,568 | ||
UW: 25.0% down · 7.5% · 30yr · 1.5% tax · 5.0% vac · 8.0% maint · 8.0% mgmt
Financing live
Cash to close
- Down payment
- $325,000
- Closing costs
- $39,000
- Reserves months
- —
- Total cash needed
- —
Loan-product check · same deal, 3 products live
Conventional
25% down · 7.5% · 30yr
- Down + closing
- —
- Monthly P&I
- —
- Monthly cashflow
- —
- DSCR
- —
- Eligible?
- —
Personal DTI + credit; lowest rate.
DSCR
20% down · 8.5% · 30yr
- Down + closing
- —
- Monthly P&I
- —
- Monthly cashflow
- —
- DSCR
- —
- Eligible?
- —
No personal income docs; deal must DSCR.
Hard money
10% down · 12.0% · 12mo
- Down + closing
- —
- Monthly P&I
- —
- Monthly cashflow
- —
- DSCR
- —
- Eligible?
- —
Short-term bridge; refi at stabilization.
Listing history 13 events
-
2026-05-04status Pending 915-char remark
Show marketing remark (915 chars)
Discover a reliable investment property at 1515 Esbenshade Rd in Manheim Township, just minutes from Lancaster City. This building was constructed as a multifamily property and is fully leased. All six units are in excellent condition, with updated interiors and well-maintained systems. The common areas are clean, the building is orderly, and the property has been consistently cared for. The current tenant base is stable and includes an on-site coin-operated laundry. The building’s condition helps keep maintenance needs and turnover low. The location offers strong rental demand, with easy access to major roads, local employers, shopping, and Lancaster City amenities. Investors benefit from reliable occupancy and predictable rental income. If you want a turnkey property with documented upkeep and solid performance, 1515 Esbenshade Rd is a straightforward, low-maintenance addition to any portfolio.
-
2026-04-16historical $1,550
-
2026-03-27price $1,550
-
2026-03-15$1,600
-
2025-11-19$1,300,000 Active 915-char remark
Show marketing remark (915 chars)
Discover a reliable investment property at 1515 Esbenshade Rd in Manheim Township, just minutes from Lancaster City. This building was constructed as a multifamily property and is fully leased. All six units are in excellent condition, with updated interiors and well-maintained systems. The common areas are clean, the building is orderly, and the property has been consistently cared for. The current tenant base is stable and includes an on-site coin-operated laundry. The building’s condition helps keep maintenance needs and turnover low. The location offers strong rental demand, with easy access to major roads, local employers, shopping, and Lancaster City amenities. Investors benefit from reliable occupancy and predictable rental income. If you want a turnkey property with documented upkeep and solid performance, 1515 Esbenshade Rd is a straightforward, low-maintenance addition to any portfolio.
-
2025-11-18historical $1,500
-
2025-11-06price $1,500
-
2025-10-29$1,600
-
2025-09-26historical $1,550
-
2025-09-17price $1,550
-
2025-09-12price $1,600
-
2025-08-24$1,650
-
1986-12-29soldstatus $166,000
ⓘ Source: listings_history table (triggers on properties + properties_extension) + one-shot
backfill from property_details.listing_events for pre-trigger history.
Tax reassessment forecast PA · Partial reset (capped growth)
- Current annual tax
- $6,526 · $544/mo
- Projected year-2 tax
- $13,533 · $1,128/mo
- Expected delta
- +$7,007/yr (+$584/mo · 107.4%)
ⓘ Screening estimate from a state-policy table — verify with the county assessor before closing.
Climate risk First Street
- Flood 1/10 Low FEMA zone X (unshaded) · 0% chance over 30 yrs
- Wildfire 1/10 Low
- Heat 6/10 Major 7 d/yr ≥101°F today · 15 d/yr by 30 yrs out
- Wind 4/10 Moderate 16% chance of damaging wind over 30 yrs
- Air quality 4/10 Moderate 4 unhealthy d/yr today · 6 by 30 yrs out
Nearby sold comps map
Loading sold comps map…
Walkable amenities ~0.75 mi
Loading nearby amenities…
Taxation est. · year 1
- Rental income
- $174,816
- − Mortgage interest
- −$72,820
- − Property taxes
- −$6,526
- − Insurance
- −$6,500
- − Repairs & maintenance
- −$13,985
- − Management
- −$13,985
- − Depreciation
- −$37,818
- Taxable income
- $23,182
- Est. tax owed @ 24.0%
- −$5,564
- After-tax cash flow
- $37,707/yr
For passive investors: Depreciation is non-cash, so a rental often shows a tax loss while cash-flowing — sheltering income. Rental losses are passive: they offset passive income freely, and up to $25,000/yr can offset ordinary (W-2) income if you actively participate and your MAGI is under $100k (phasing out to $0 by $150k); unused losses carry forward. On sale, claimed depreciation is recaptured at up to 25%, and gains may owe capital-gains tax (a 1031 exchange can defer both). Figures are a year-1 estimate at your 24.0% rate — not tax advice; consult a CPA.
Schools (NCES district)
- District
- Manheim Township SD
- NCES district ID
- 4214580
- Math proficiency
- 53% ▼ -10.00%
- Reading proficiency
- 68% ▼ -11.00%
- Median HH income
- $68,335
- Composite
- 53.18/100
- National rank
- #1506
- State rank
- #61 of 539 in PA
Livability — Lancaster
- Score
- 85/100
- State rank
- #71
- US rank
- #498
Category grades
Schools grade is shown separately in the Schools card above.
Census & demographics
- County
- Lancaster County · 390,309 people
- City population
- 176,170
- Metro
- Lancaster, PA
- Population (ZIP)
- 56,382
- Household income
- $102,435
- Rent vs Own
- Severe rent burden
- 1296.0
Population outlook (Lancaster County) Hauer SSP2
- Today (2025)
- 561,011 people
- By 2030
- 570,969 · +1.8%
- By 2040
- 585,929 · +4.4%
- By 2050
- 591,056 · +5.4%
- By 2075
- 594,747 · +6.0%
- By 2100
- 558,850 · -0.4%
Race, ethnicity, and origin ACS 2023
- Neighborhood character
- Predominantly White (78%)
- Race & ethnicity
- White 78% Hispanic / Latino 10% Two or more races 7% Asian 6% Black 4%
- Hispanic origin (detail)
- Puerto Rican 5%
- Common ancestry
- Romanian 5% Slovak 2% Lithuanian 2%
- Foreign-born
- 9% · Canada, Vietnam, China
- Languages at home
- 86% English-only · Spanish 5% Other Indo-European 2% French/Haitian/Cajun 1%
Political lean MEDSL · Lancaster
- 2024 margin
- R (+15.9) · D 41.5% · R 57.5%
- 2008→2024 swing
- -4.1pp toward R · 2008: -11.8pp · 2024: -15.9pp
- All cycles
- 2024: R+15.9 2020: R+15.8 2016: R+19.7 2012: R+19.2 2008: R+11.8
Not yet ingested
- Civics
- —
Market trends
- HPI YoY
- ▼ -383.04%
- Current HPI
- 257.0336
- Rent YoY
- ▲ 3.99%
- Metro
- Lancaster, PA
- State GDP YoY
- ▲ 1.68%
- F500 in state
- 34
Industry mix (Fortune 500 HQ in PA)
| Industry | F500 HQs | Revenue |
|---|---|---|
| Healthcare | 2 | $309B |
|
||
| Insurance | 2 | $27B |
|
||
| Telecommunications / Media | 1 | $124B |
|
||
| Industrial Distribution | 1 | $22B |
|
||
| Financial Services | 1 | $20B |
|
||
| Chemicals / Materials | 1 | $18B |
|
||
Price history
-99.1% since first listed13 events — show timeline
- 2026-05-04 Pending — BRIGHT MLS
- 2026-04-16 Rental Removed $1,550 RENTALBEAST
- 2026-03-27 Price Changed $1,550 RENTALBEAST
- 2026-03-15 Listed for Rent $1,600 RENTALBEAST
- 2025-11-19 Listed $1,300,000 BRIGHT MLS
- 2025-11-18 Rental Removed $1,500 RENTALBEAST
- 2025-11-06 Price Changed $1,500 RENTALBEAST
- 2025-10-29 Listed for Rent $1,600 RENTALBEAST
- 2025-09-26 Rental Removed $1,550 RENTALBEAST
- 2025-09-17 Price Changed $1,550 RENTALBEAST
- 2025-09-12 Price Changed $1,600 RENTALBEAST
- 2025-08-24 Listed for Rent $1,650 RENTALBEAST
- 1986-12-29 Sold (Public Records) $166,000 Public Records
Property tax history
+2.6%/yrLatest (2026): $6,526 · +6.5% YoY. Source: county tax records.
Cash-flow waterfall
monthlySold comps — $/sqft
last 12 mo · ≤1 miLoading sold comps…