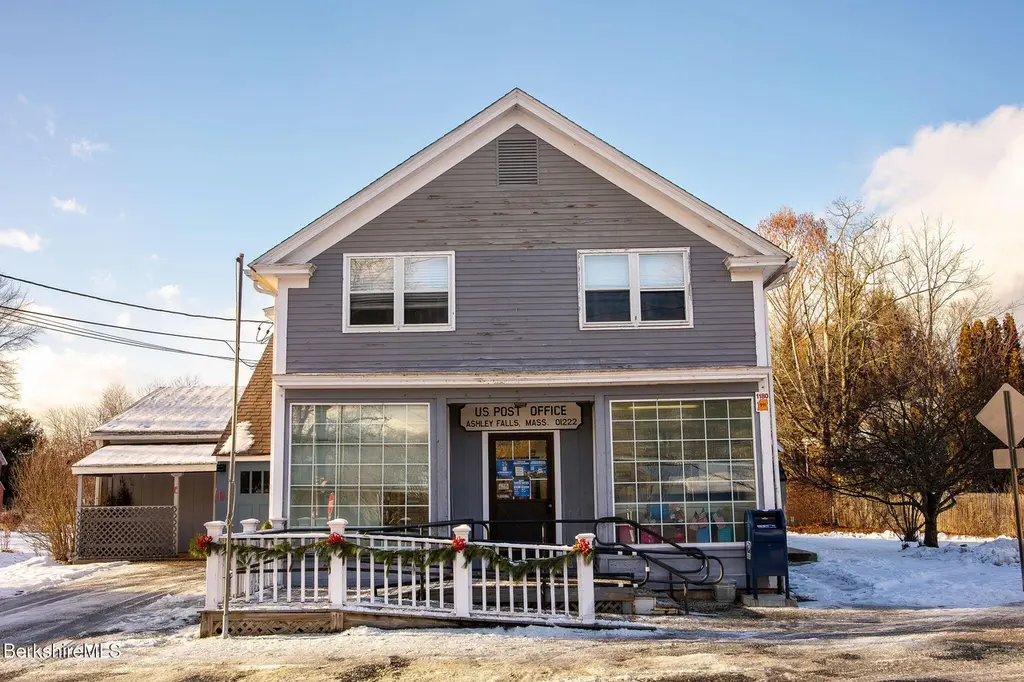
1180 Ashley Falls Rd Unit A,B,C,D,E
Canaan, CT 01222
$695,000D
3 bd · 4.5 ba ·
4,044 sqft ·
Built 1860
· MultiFamily
· Active
· 52 DOM
Cashflow @ list (25.0% down · 7.5%)
Estimated rent
$5,059/mo
Mortgage (P&I)
−$3,645
Tax + insurance
−$1,158
HOA
−$0
Vac / Maint / Mgmt
−$1,062
Net cashflow
$-806/mo
Annual
$-9,677/yr
Cap rate
4.90%
Cash-on-cash
-4.97%
DSCR
0.78
1% rule
0.73%
Cash to close
$194,600
Investor read
- This is a 3-bed/4.5-bath multifamily listed at $695k.
- At list price, monthly cash flow is $-806 ($-10k/yr) — negative.
- To cash-flow at today's rent, offer at most $578k (16.8% below list).
- To meet the 1% rule (rent ≥ 1% of price), the offer needs to be $506k (27.2% below list).
- It's been on market 52 days — a 3% lower offer ($674k) is reasonable based on typical stale-listing flexibility.
- Recommended offer: $506k (27.2% below list) — sets the bar for 1% rule.
- Local home prices are declining (-1.3%/yr); year-one equity from $5k of loan paydown is wiped out by about $9k of value loss. Plan a longer hold.
- Location reads 62/100 on livability (#133 in CT) — a middle-class / working-renter tenant base. Strengths: crime A+, cost of living A; Watch: amenities F, commute F, employment F.
- Southern Berkshire (rural): math 22% / reading 44% proficiency, ranked #243 of 302 in MA (top 80%) — families likely to look elsewhere, expect single-tenant / working-renter base with shorter leases.
- Zoned schools: Undermountain (math 22% / reading 37%, grade F, #663 of 938 statewide, top 73%, 241 students, 0% FRL) — zoned schools average 0% FRL vs 25% district-wide (25 pts lower); this property's tenant base skews higher-income than the district average.
- Watch-outs: built in 1860 — expect roof / HVAC / electrical / plumbing capex.
- Market conditions: 130 units permitted in Berkshire County in 2024 (10 in 5+ unit buildings).
- Berkshire County population projected at -24% by 2050 — secular population decline; favor cash flow + early exit over multi-decade hold.
- 2 sale attempts with the ask held roughly flat each time — persistent listings suggest the price (not the market) is what's stuck; bring a comps-based counter.
- Cap rate 4.9% vs local median 1.7% in Canaan — top-decile yield for the area; either an underpriced asset or a hidden risk that comps aren't pricing in. Stress-test before assuming the spread holds.
Questions for listing agent
- What do current leases actually rent for vs. the listed asking? Can we see a recent rent roll and the last 12 months of T-12 income?
- It's been on market 52 days. Have you received any prior offers? Is the seller open to a 27% concession, seller financing, or rate buy-down credit?
- Built in 1860 — when were the roof, HVAC, electrical panel, plumbing, and water heater last replaced?
- Is there a deadline driving the sale (1031 exchange, divorce, estate, relocation)? That informs how much negotiation room exists.
- The area grade is low — what's the realistic commute time and amenity access for the typical tenant pool here? Any planned neighborhood developments (good or bad) we should know about?
- What's the average days-on-market for RENTAL listings here right now (not sales)? A rising rental-DOM trend means longer vacancies and softer asking-rent achievability than the comps imply.
- What's the recent tenant-quality profile in this submarket — average credit score on applications, eviction rate, late-payment / NSF rate, and stable-employment percentage? A property-management company in the area should have these aggregated.
- How much new apartment / multifamily construction is in the pipeline within 1–3 miles? Heavy new supply (>2% of stock underway) typically softens rents 12–24 months out; light construction supports rent growth.
CashFlowRE · CFR-PR5MZSEXYAP2RB
· Data 2 days ago
cashflowre.app · 2026-05-29