 Multi-family
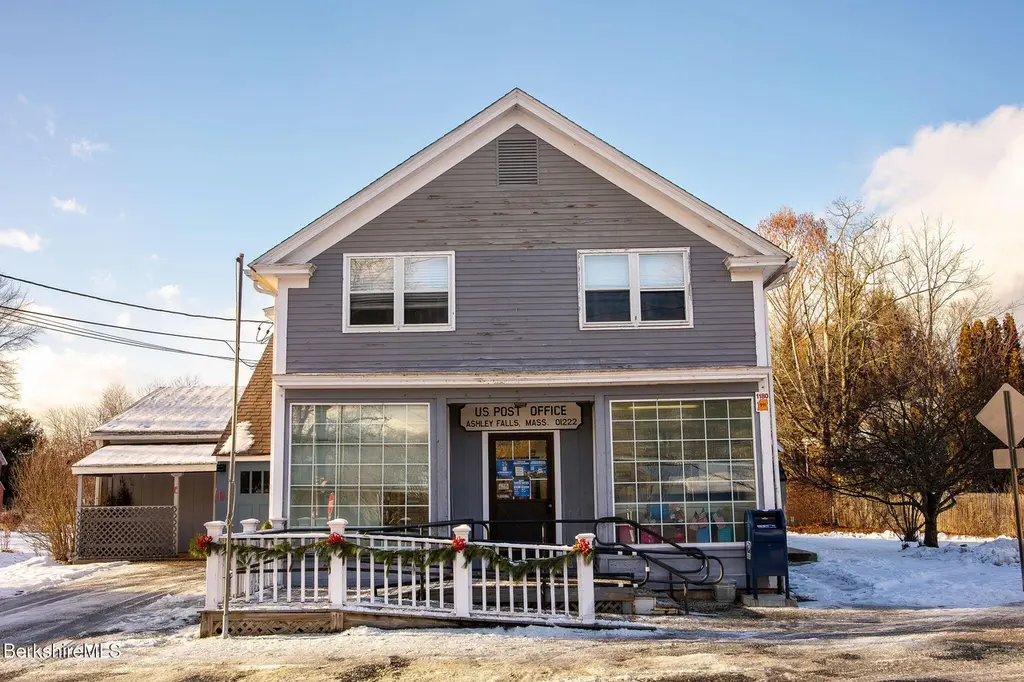
1180 Ashley Falls Rd Unit A,B,C,D,E · Canaan, CT
Flood risk 1/10 · Minimal
- FEMA flood zone
- X
- Chance of flooding over 30 yrs
- 0.0%
- Est. flood insurance / yr
- $507 – $1,088
Fire risk 1/10 · Minimal
- Est. fire insurance / yr
- $915 – $1,699
Heat risk 3/10 · Minor
- Hot days now (above 94°F)
- 7 days/yr
- Hot days in 30 yrs
- 16 days/yr
Wind risk 4/10 · Minor
- Chance of severe wind over 30 yrs
- 15.0%
Air-quality risk 2/10 · Minimal
- Unhealthy air days now
- 1 days/yr
- Unhealthy air days in 30 yrs
- 2 days/yr
Risk factors via First Street. Map © Google.
Why this score? — see what drove the D grade
The composite is a weighted blend of 9 inputs, each scored 0–100. Each bar is that input's sub-score; the figure is the points it added to the 100-point composite (weight × sub-score).
- ARV discount +15.0/15.0
- Cash flow +7.7/30.0
- Appreciation +4.3/10.0
- Livability +3.1/5.0
- Schools +3.0/10.0
- Rent growth +2.5/5.0
- Condition / age +2.5/5.0
- 1% rule +2.3/10.0
- DSCR +1.8/10.0
$695,000
🖨 Deal sheet 📄 Offer letter ✓ Due diligence
Multi-family units
County records classify this as Multi-Family (2-4 Unit). Listing-text estimate: 1 unit. estimate disagrees with records
Listing remarks
Old Historic Village downtown location! The centrally located Post Office building constructed in 1860, presents a unique opportunity for both residential and commercial use. Its strategic location ensures consistent foot traffic, making it an invaluable cornerstone of village life. With no mail delivery service in Ashley Falls, the Post Office attracts local residents daily. This building is offered for sale with 3 business rentals and 2 apartments creating a living and income opportunity.
Key facts
- Business rentals
- Post office building
- Income opportunity
Tags
Property features AI
Exterior
- Utilities: Individual electric meter; Private sewer
- Home design: Updated/Remodeled; Asphalt roof
- Construction: Approximately 4044 total building area
- Exterior features: Landscaped; Near public bus service
Interior
- Flooring: Wood flooring
- Bathrooms: 3 full bathrooms; 3 half bathrooms
- Heating & cooling: Oil heating; Electric heating
- Interior features: Cable available; Vaulted ceilings
- Laundry & utility: Coin-operated laundry
Neighborhood map
What this means for you Summary
Snapshot
- This is a 3-bed/4.5-bath multifamily listed at $695k.
Deal economics
- At list price, monthly cash flow is $-806 ($-10k/yr) — negative.
- To cash-flow at today's rent, offer at most $578k (16.8% below list).
- To meet the 1% rule (rent ≥ 1% of price), the offer needs to be $506k (27.2% below list).
- Recommended offer: $506k (27.2% below list) — sets the bar for 1% rule.
- Cap rate 4.9% vs local median 1.7% in Canaan — top-decile yield for the area; either an underpriced asset or a hidden risk that comps aren't pricing in. Stress-test before assuming the spread holds.
Location & tenants
- Location reads 62/100 on livability (#133 in CT) — a middle-class / working-renter tenant base. Strengths: crime A+, cost of living A; Watch: amenities F, commute F, employment F.
- Southern Berkshire (rural): math 22% / reading 44% proficiency, ranked #243 of 302 in MA (top 80%) — families likely to look elsewhere, expect single-tenant / working-renter base with shorter leases.
- Zoned schools: Undermountain (math 22% / reading 37%, grade F, #663 of 938 statewide, top 73%, 241 students, 0% FRL) — zoned schools average 0% FRL vs 25% district-wide (25 pts lower); this property's tenant base skews higher-income than the district average.
- Market conditions: 130 units permitted in Berkshire County in 2024 (10 in 5+ unit buildings).
Forward outlook
- Local home prices are declining (-1.3%/yr); year-one equity from $5k of loan paydown is wiped out by about $9k of value loss. Plan a longer hold.
- Berkshire County population projected at -24% by 2050 — secular population decline; favor cash flow + early exit over multi-decade hold.
Negotiation context
- It's been on market 52 days — a 3% lower offer ($674k) is reasonable based on typical stale-listing flexibility.
- 2 sale attempts with the ask held roughly flat each time — persistent listings suggest the price (not the market) is what's stuck; bring a comps-based counter.
Risks & watch-outs
- Watch-outs: built in 1860 — expect roof / HVAC / electrical / plumbing capex.
Questions for the listing agent
- What do current leases actually rent for vs. the listed asking? Can we see a recent rent roll and the last 12 months of T-12 income?
- It's been on market 52 days. Have you received any prior offers? Is the seller open to a 27% concession, seller financing, or rate buy-down credit?
- Built in 1860 — when were the roof, HVAC, electrical panel, plumbing, and water heater last replaced?
- Is there a deadline driving the sale (1031 exchange, divorce, estate, relocation)? That informs how much negotiation room exists.
- The area grade is low — what's the realistic commute time and amenity access for the typical tenant pool here? Any planned neighborhood developments (good or bad) we should know about?
- What's the average days-on-market for RENTAL listings here right now (not sales)? A rising rental-DOM trend means longer vacancies and softer asking-rent achievability than the comps imply.
- What's the recent tenant-quality profile in this submarket — average credit score on applications, eviction rate, late-payment / NSF rate, and stable-employment percentage? A property-management company in the area should have these aggregated.
- How much new apartment / multifamily construction is in the pipeline within 1–3 miles? Heavy new supply (>2% of stock underway) typically softens rents 12–24 months out; light construction supports rent growth.
Investment metrics
- 1% rule
- 0.73% ✗
- Cap rate
- 4.90%
- Cash-on-cash
- -4.97%
- DSCR
- 0.78
- GRM
- 11.4
CMA / ARV
- ARV (median comp)
- $873,990
- List price
- $695,000
- Delta
- -20.48%
- Verdict
- UNDERPRICED
- Comps
- 1 within 2.0 mi
Projected returns pro-forma
-1.31% appreciation · 3.0% rent growth · sell at horizon
- IRR
- -14.0%
- Equity multiple
- 0.42×
- Total profit
- $-113,412
- Equity at exit
- $157,339
- IRR
- -7.1%
- Equity multiple
- 0.39×
- Total profit
- $-117,929
- Equity at exit
- $156,492
Cash invested: $194,600 (down + closing). Projections, not guarantees.
Landlord ↔ Tenant lean methodology
- Overall (STATE)
- 27 Tenant-Leaning
- State Connecticut
- 27 Tenant-Leaning · D+7
- County
- — inherits STATE
- City
- — inherits STATE
ZIP-level market 01222
- Home prices YoY
- -0.5%
- Price-to-rent
- 57.2×
Monthly cashflow live
- Estimated rent
- $5,059 medium interval (Pro) →
- Mortgage (P&I)
- −$3,645
- Tax est. 1.5%
- −$869 /mo · $10,425/yr
- Insurance
- −$290
- HOA
- −$0
- Vacancy / Maint / Mgmt
- −$1,062
- Net cashflow
- $-806
Break-even live
5-unit breakdown (identical units grouped — click to expand)
| Units | Beds | Baths | Est. rent |
|---|---|---|---|
| 5× units | 1 | 1 | $5,060 |
| #1 | 1 | 1 | $1,012 |
| #2 | 1 | 1 | $1,012 |
| #3 | 1 | 1 | $1,012 |
| #4 | 1 | 1 | $1,012 |
| #5 | 1 | 1 | $1,012 |
| Total (5 units) | $5,059 | ||
UW: 25.0% down · 7.5% · 30yr · 1.5% tax · 5.0% vac · 8.0% maint · 8.0% mgmt
Financing live
Cash to close
- Down payment
- $173,750
- Closing costs
- $20,850
- Reserves months
- —
- Total cash needed
- —
Loan-product check · same deal, 3 products live
Conventional
25% down · 7.5% · 30yr
- Down + closing
- —
- Monthly P&I
- —
- Monthly cashflow
- —
- DSCR
- —
- Eligible?
- —
Personal DTI + credit; lowest rate.
DSCR
20% down · 8.5% · 30yr
- Down + closing
- —
- Monthly P&I
- —
- Monthly cashflow
- —
- DSCR
- —
- Eligible?
- —
No personal income docs; deal must DSCR.
Hard money
10% down · 12.0% · 12mo
- Down + closing
- —
- Monthly P&I
- —
- Monthly cashflow
- —
- DSCR
- —
- Eligible?
- —
Short-term bridge; refi at stabilization.
Listing history 18 events
-
2026-06-18days on market $695,000 Active 52 DOM
-
2026-06-17days on market $695,000 Active 51 DOM
-
2026-06-16days on market $695,000 Active 50 DOM
-
2026-06-15days on market $695,000 Active 49 DOM
-
2026-06-13days on market $695,000 Active 47 DOM
-
2026-06-12days on market $695,000 Active 46 DOM
-
2026-06-09days on market $695,000 Active 43 DOM
-
2026-06-08days on market $695,000 Active 42 DOM
-
2026-06-07days on market $695,000 Active 41 DOM
-
2026-06-07days on market $695,000 Active 40 DOM
-
2026-06-04days on market $695,000 Active 37 DOM
-
2026-06-02days on market $695,000 Active 36 DOM
-
2026-06-01days on market $695,000 Active 35 DOM
-
2026-05-31days on market $695,000 Active 34 DOM
-
2026-05-31days on market $695,000 Active 33 DOM
-
2026-04-01historical
-
2025-06-21$695,000 Active
-
2025-06-21$695,000 Active 496-char remark
ⓘ Source: listings_history table (triggers on properties + properties_extension) + one-shot
backfill from property_details.listing_events for pre-trigger history.
Climate risk First Street
- Flood 1/10 Low FEMA zone X · 0% chance over 30 yrs
- Wildfire 1/10 Low
- Heat 3/10 Moderate 7 d/yr ≥94°F today · 16 d/yr by 30 yrs out
- Wind 4/10 Moderate 15% chance of damaging wind over 30 yrs
- Air quality 2/10 Low 1 unhealthy d/yr today · 2 by 30 yrs out
Nearby sold comps map
Loading sold comps map…
Walkable amenities ~0.75 mi
Loading nearby amenities…
Taxation est. · year 1
- Rental income
- $60,708
- − Mortgage interest
- −$38,931
- − Property taxes
- −$10,425
- − Insurance
- −$3,475
- − Repairs & maintenance
- −$4,857
- − Management
- −$4,857
- − Depreciation
- −$20,218
- Taxable loss
- −$22,054
- Est. tax savings @ 24.0%
- +$5,293
- After-tax cash flow
- $-4,384/yr
For passive investors: Depreciation is non-cash, so a rental often shows a tax loss while cash-flowing — sheltering income. Rental losses are passive: they offset passive income freely, and up to $25,000/yr can offset ordinary (W-2) income if you actively participate and your MAGI is under $100k (phasing out to $0 by $150k); unused losses carry forward. On sale, claimed depreciation is recaptured at up to 25%, and gains may owe capital-gains tax (a 1031 exchange can defer both). Figures are a year-1 estimate at your 24.0% rate — not tax advice; consult a CPA.
Schools (NCES district)
- District
- Southern Berkshire
- NCES district ID
- 2511040
- Math proficiency
- 22% ▼ -16.00%
- Reading proficiency
- 44% ▼ -7.00%
- Median HH income
- $60,031
- Composite
- 29.56/100
- National rank
- #6489
- State rank
- #243 of 302 in MA
Livability — Canaan
- Score
- 62/100
- State rank
- #133
- US rank
- #16567
Category grades
Schools grade is shown separately in the Schools card above.
Census & demographics
- Population (ZIP)
- 611
Population outlook (Berkshire County) Hauer SSP2
- Today (2025)
- 119,723 people
- By 2030
- 114,608 · -4.3%
- By 2040
- 102,806 · -14.1%
- By 2050
- 91,305 · -23.7%
- By 2075
- 71,517 · -40.3%
- By 2100
- 57,988 · -51.6%
Race, ethnicity, and origin ACS 2023
- Neighborhood character
- Predominantly White (96%)
- Race & ethnicity
- White 96% Hispanic / Latino 4% Two or more races 1%
- Common ancestry
- Slovak 4% German 4% Lithuanian 3%
- Foreign-born
- 3% · Canada
- Languages at home
- 95% English-only · Spanish 5%
Political lean MEDSL · Berkshire
- 2024 margin
- Solid D (+39.9) · D 68.9% · R 29.0% · Other 2.1%
- 2008→2024 swing
- -12.5pp toward R · 2008: 52.4pp · 2024: 39.9pp
- All cycles
- 2024: D+39.9 2020: D+47.1 2016: D+41.5 2012: D+53.7 2008: D+52.4
Not yet ingested
- Civics
- —
Market trends
- HPI YoY
- ▼ -1.31%
- Current HPI
- 264.0021
- Rent YoY
- —
- Metro
- —
- State GDP YoY
- ▲ 1.06%
- F500 in state
- 38
Industry mix (Fortune 500 HQ in CT)
| Industry | F500 HQs | Revenue |
|---|---|---|
| Industrial Machinery | 4 | $38B |
|
||
| Insurance | 3 | $71B |
|
||
| Financial Services | 2 | $25B |
|
||
| Transportation / Logistics | 2 | $18B |
|
||
| Healthcare | 1 | $247B |
|
||
| Telecommunications | 1 | $55B |
|
||
Price history
+0.0% since first listed3 events — show timeline
- 2026-04-01 Listing Removed — BCMLS
- 2025-06-21 Listed $695,000 BCMLS
- 2025-06-21 Listed $695,000 BCMLS
Cash-flow waterfall
monthlySold comps — $/sqft
last 12 mo · ≤1 miLoading sold comps…