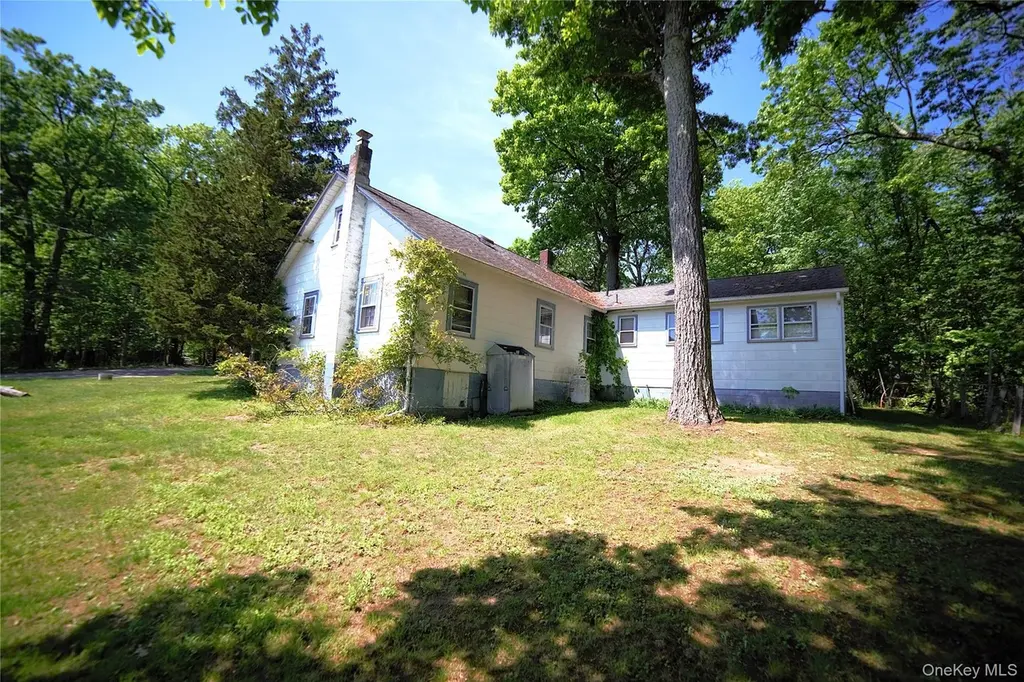
3 Jefferson St
Woodbury, NY 10930
$325,000C+
4 bd · 1.5 ba ·
1,488 sqft ·
Built 1940
· SingleFamily
· Active
· 14 DOM
Cashflow @ list (25.0% down · 7.5%)
Estimated rent
$3,689/mo
Mortgage (P&I)
−$1,704
Tax + insurance
−$687
HOA
−$0
Vac / Maint / Mgmt
−$775
Net cashflow
$523/mo
Annual
$6,278/yr
Cap rate
8.22%
Cash-on-cash
6.90%
DSCR
1.31
1% rule
1.14%
Cash to close
$91,000
Investor read
- This is a 4-bed/1.5-bath single-family listed at $325k.
- At list price, monthly cash flow is $523 ($6k/yr) — positive.
- The deal already cash-flows at list — no discount required.
- Meets the 1% rule at list price ($4k rent vs $325k).
- Only 14 days on market — expect competitive offers; lowballing is unlikely to land.
- Local home prices are declining (-3.0%/yr); year-one equity from $2k of loan paydown is wiped out by about $10k of value loss. Plan a longer hold.
- Location reads 66/100 on livability (#663 in NY) — a middle-class / working-renter tenant base. Strengths: employment A+, housing A+; Watch: amenities F, commute F, cost of living F.
- Monroe-Woodbury Central School District (suburban): math 50% / reading 56% proficiency, ranked #250 of 590 in NY (top 42%) — acceptable for families but not a draw, mixed tenant base, ~2y average lease; only 15% free/reduced lunch — higher-income household profile.
- Zoned schools: Central Valley Elementary School (math 31% / reading 53%, grade F, #1,361 of 2,108 statewide, top 67%, 448 students, 43% FRL); Monroe-Woodbury Middle School (math 28% / reading 50%, grade F, #433 of 729 statewide, top 60%, 1,584 students, 40% FRL); Monroe-Woodbury High School (math 98% / reading 95%, grade A+, #56 of 1,100 statewide, top 5%, 2,353 students, 33% FRL) — zoned schools average 39% FRL vs 15% district-wide (24 pts higher); higher-poverty schools than district average — tighter screening recommended.
- Watch-outs: built in 1940 — expect roof / HVAC / electrical / plumbing capex.
- Market conditions: 82 active listings in the ZIP; 3 comparable units currently listed for rent nearby; rentals at typical pace (median 22d on market — plan ~3-4 weeks tenant-placement turnaround); high-income renter base; 1,746 units permitted in Orange County in 2024 (1,265 in 5+ unit buildings).
- Climate carrying-cost: moderate wildfire risk — expect insurance premiums to compound above CPI over the hold.
- Cap rate 8.2% vs local median 1.9% in Woodbury — top-decile yield for the area; either an underpriced asset or a hidden risk that comps aren't pricing in. Stress-test before assuming the spread holds.
- This rent runs 37% of the median local income ($120k/yr) — at the standard rent-burdened threshold; future hikes will face affordability resistance.
Questions for listing agent
- Built in 1940 — when were the roof, HVAC, electrical panel, plumbing, and water heater last replaced?
- Is there a deadline driving the sale (1031 exchange, divorce, estate, relocation)? That informs how much negotiation room exists.
- Schools are A-rated — typically a magnet for longer-tenancy family renters. What's the average tenant stay here, and is there a school-zone premium baked into asking?
- What's the average days-on-market for RENTAL listings here right now (not sales)? A rising rental-DOM trend means longer vacancies and softer asking-rent achievability than the comps imply.
- What's the recent tenant-quality profile in this submarket — average credit score on applications, eviction rate, late-payment / NSF rate, and stable-employment percentage? A property-management company in the area should have these aggregated.
- How much new for-sale + rental construction is in the pipeline within 1–3 miles? Heavy new supply typically softens prices + rents 12–24 months out; constrained supply supports both.
CashFlowRE · CFR-PSHB5603JSR3SF
· Data 2 days ago
cashflowre.app · 2026-05-29