 🏷️ Likely Rental
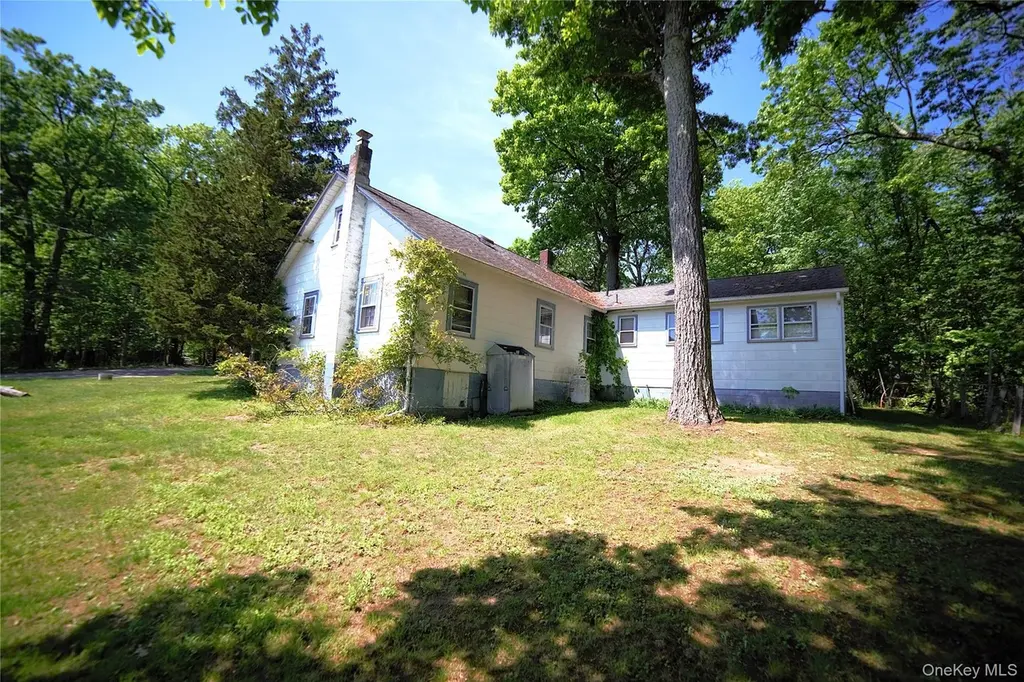
3 Jefferson St · Woodbury, NY
Flood risk 1/10 · Minimal
- FEMA flood zone
- X (unshaded)
- Chance of flooding over 30 yrs
- 0.0%
- Est. flood insurance / yr
- $507 – $1,088
Fire risk 5/10 · Moderate
- Est. fire insurance / yr
- $691 – $1,283
Heat risk 4/10 · Minor
- Hot days now (above 96°F)
- 7 days/yr
- Hot days in 30 yrs
- 15 days/yr
Wind risk 4/10 · Minor
- Chance of severe wind over 30 yrs
- 15.0%
Air-quality risk 2/10 · Minimal
- Unhealthy air days now
- 1 days/yr
- Unhealthy air days in 30 yrs
- 2 days/yr
Risk factors via First Street. Map © Google.
Why this score? — see what drove the C+ grade
The composite is a weighted blend of 9 inputs, each scored 0–100. Each bar is that input's sub-score; the figure is the points it added to the 100-point composite (weight × sub-score).
- Cash flow +22.1/30.0
- ARV discount +15.0/15.0
- DSCR +7.1/10.0
- 1% rule +6.4/10.0
- Schools +5.0/10.0
- Livability +3.3/5.0
- Rent growth +2.5/5.0
- Condition / age +2.5/5.0
- Appreciation +0.0/10.0
$325,000
🖨 Deal sheet 📄 Offer letter ✓ Due diligence
Listing remarks
Charming 4-bedroom, 1.5-bath home situated on a level lot in the desirable Woodbury community of Highland Mills. Features include spacious living areas, a country kitchen, 4 bedrooms, and a private wooded yard perfect for outdoor enjoyment. Conveniently located near shopping, parks, major commuter routes, and within the Monroe-Woodbury School District. Great opportunity to own a home in a sought-after location. Solar panels are leased at $55/month
Key facts
- Country kitchen
- Private wooded yard
- 0.32 acre lot
Tags
Property features AI
Exterior
- Parking: Driveway; 2-car garage
- Utilities: Electricity connected; Public sewer; Electric service by Orange & Rockland
- Home design: Single family residence
- Construction: Asbestos exterior construction; Crawl space foundation
- Exterior features: Wooded lot; Not waterfront
Interior
- Kitchen: Gas range; Range
- Bedrooms: Includes a bedroom on the first floor
- Bathrooms: 1 full bathroom; 1 half bathroom
- Heating & cooling: Forced air heating; Oil heating; No central cooling
- Interior features: First-floor bedroom; 7 total rooms; Crawl space/attic
- Laundry & utility: Washer; Dryer
Neighborhood map
What this means for you Summary
Snapshot
- This is a 4-bed/1.5-bath single-family listed at $325k.
Deal economics
- At list price, monthly cash flow is $523 ($6k/yr) — positive.
- The deal already cash-flows at list — no discount required.
- Meets the 1% rule at list price ($4k rent vs $325k).
- Cap rate 8.2% vs local median 1.9% in Woodbury — top-decile yield for the area; either an underpriced asset or a hidden risk that comps aren't pricing in. Stress-test before assuming the spread holds.
Location & tenants
- Location reads 66/100 on livability (#663 in NY) — a middle-class / working-renter tenant base. Strengths: employment A+, housing A+; Watch: amenities F, commute F, cost of living F.
- Monroe-Woodbury Central School District (suburban): math 50% / reading 56% proficiency, ranked #250 of 590 in NY (top 42%) — acceptable for families but not a draw, mixed tenant base, ~2y average lease; only 15% free/reduced lunch — higher-income household profile.
- Zoned schools: Central Valley Elementary School (math 31% / reading 53%, grade F, #1,361 of 2,108 statewide, top 67%, 448 students, 43% FRL); Monroe-Woodbury Middle School (math 28% / reading 50%, grade F, #433 of 729 statewide, top 60%, 1,584 students, 40% FRL); Monroe-Woodbury High School (math 98% / reading 95%, grade A+, #56 of 1,100 statewide, top 5%, 2,353 students, 33% FRL) — zoned schools average 39% FRL vs 15% district-wide (24 pts higher); higher-poverty schools than district average — tighter screening recommended.
- Market conditions: 82 active listings in the ZIP; 3 comparable units currently listed for rent nearby; rentals at typical pace (median 21d on market — plan ~3-4 weeks tenant-placement turnaround); high-income renter base; 1,746 units permitted in Orange County in 2024 (1,265 in 5+ unit buildings).
- This rent runs 37% of the median local income ($120k/yr) — at the standard rent-burdened threshold; future hikes will face affordability resistance.
Forward outlook
- Local home prices are declining (-3.0%/yr); year-one equity from $2k of loan paydown is wiped out by about $10k of value loss. Plan a longer hold.
Negotiation context
- Only 14 days on market — expect competitive offers; lowballing is unlikely to land.
Risks & watch-outs
- Watch-outs: built in 1940 — expect roof / HVAC / electrical / plumbing capex.
- Climate carrying-cost: moderate wildfire risk — expect insurance premiums to compound above CPI over the hold.
Questions for the listing agent
- Built in 1940 — when were the roof, HVAC, electrical panel, plumbing, and water heater last replaced?
- Is there a deadline driving the sale (1031 exchange, divorce, estate, relocation)? That informs how much negotiation room exists.
- Schools are A-rated — typically a magnet for longer-tenancy family renters. What's the average tenant stay here, and is there a school-zone premium baked into asking?
- What's the average days-on-market for RENTAL listings here right now (not sales)? A rising rental-DOM trend means longer vacancies and softer asking-rent achievability than the comps imply.
- What's the recent tenant-quality profile in this submarket — average credit score on applications, eviction rate, late-payment / NSF rate, and stable-employment percentage? A property-management company in the area should have these aggregated.
- How much new for-sale + rental construction is in the pipeline within 1–3 miles? Heavy new supply typically softens prices + rents 12–24 months out; constrained supply supports both.
Investment metrics
- 1% rule
- 1.14% ✓
- Cap rate
- 8.22%
- Cash-on-cash
- 6.90%
- DSCR
- 1.31
- GRM
- 7.3
CMA / ARV
- ARV (on-the-fly)
- $427,056
- Comps found
- 12
Show comp detail 12 sales within ~0.75 mi
| Address | Dist | Beds/Ba | Sqft | Sold | Price | $/sf | Match |
|---|---|---|---|---|---|---|---|
| 93 Weygant Hl | 0.14mi | 3/2.0 (-1) | 1,512 (+2%) | 3mo | $445,000 | $294 | 81 |
| 17 Hickory St | 0.39mi | 4/1.5 | 1,546 (+4%) | 2mo | $399,000 | $258 | 74 |
| 7 Sycamore Ct | 0.36mi | 3/2.0 (-1) | 1,518 (+2%) | 4mo | $455,000 | $300 | 70 |
| 8 Ledger View Ct | 0.25mi | 3/2.5 (-1) | 1,569 (+5%) | 6mo | $500,000 | $319 | 65 |
| 3 Laurel Ct | 0.31mi | 3/2.5 (-1) | 1,575 (+6%) | 3mo | $429,900 | $273 | 64 |
| 10 Cliffside Ct | 0.35mi | 3/2.5 (-1) | 1,569 (+5%) | 10mo | $485,000 | $309 | 57 |
| 4 Cliffside Ct | 0.38mi | 3/2.5 (-1) | 1,569 (+5%) | 10mo | $450,000 | $287 | 56 |
| 10 Ironwood Dr | 0.38mi | 3/2.5 (-1) | 1,614 (+8%) | 5mo | $420,000 | $260 | 56 |
| 13 Butternut Ct | 0.28mi | 3/2.5 (-1) | 1,704 (+14%) | 2mo | $435,000 | $255 | 52 |
| 183 Ridge Rd | 0.59mi | 4/2.5 | 1,644 (+10%) | 19mo | $545,000 | $332 | 35 |
| 10 Park Ave | 0.66mi | 3/2.0 (-1) | 1,348 (-9%) | 15mo | $321,000 | $238 | 34 |
| 6 Lilac Dr | 0.70mi | 3/2.0 (-1) | 1,587 (+7%) | 20mo | $160,000 | $101 | 33 |
Match score weights: distance 35% · size 25% · config 20% · recency 20%. Top-matched comps best support the ARV.
Projected returns pro-forma
-3.0% appreciation · 3.0% rent growth · sell at horizon
- IRR
- -5.7%
- Equity multiple
- 0.79×
- Total profit
- $-19,199
- Equity at exit
- $48,459
- IRR
- 4.0%
- Equity multiple
- 1.29×
- Total profit
- $26,775
- Equity at exit
- $28,100
Cash invested: $91,000 (down + closing). Projections, not guarantees.
Landlord ↔ Tenant lean methodology
- Overall (STATE)
- 15 Strongly Tenant-Friendly
- State New York
- 15 Strongly Tenant-Friendly · D+10
- County
- — inherits STATE
- City
- — inherits STATE
ZIP-level market 10930
- Home prices YoY
- -15.8%
- Active inventory
- 82
- Price-to-rent
- 7.3×
Monthly cashflow live
- Estimated rent
- $3,689 medium interval (Pro) →
- Mortgage (P&I)
- −$1,704
- Tax from tax record
- −$552 /mo · $6,620/yr
- Insurance
- −$135
- HOA
- −$0
- Vacancy / Maint / Mgmt
- −$775
- Net cashflow
- $523
Break-even live
UW: 25.0% down · 7.5% · 30yr · 1.5% tax · 5.0% vac · 8.0% maint · 8.0% mgmt
Financing live
Cash to close
- Down payment
- $81,250
- Closing costs
- $9,750
- Reserves months
- —
- Total cash needed
- —
Loan-product check · same deal, 3 products live
Conventional
25% down · 7.5% · 30yr
- Down + closing
- —
- Monthly P&I
- —
- Monthly cashflow
- —
- DSCR
- —
- Eligible?
- —
Personal DTI + credit; lowest rate.
DSCR
20% down · 8.5% · 30yr
- Down + closing
- —
- Monthly P&I
- —
- Monthly cashflow
- —
- DSCR
- —
- Eligible?
- —
No personal income docs; deal must DSCR.
Hard money
10% down · 12.0% · 12mo
- Down + closing
- —
- Monthly P&I
- —
- Monthly cashflow
- —
- DSCR
- —
- Eligible?
- —
Short-term bridge; refi at stabilization.
Rent comps 3 comps
| Address | Beds | Baths | Sqft | Rent | $/sqft | DOM | Units | Dist |
|---|---|---|---|---|---|---|---|---|
| 8 Fillmore Ct Highland Mills, NY | 3.0 | 1.5 | 1836 | $3,300 | $1.80 | 21d | 1 | 0.11mi |
| 19 Mountainview Dr Highland Mills, NY | 4.0 | 1.5 | 1622 | $3,500 | $2.16 | 23d | 1 | 0.34mi |
| 468 State Route 32 Highland Mills, NY | 3.0 | 2.5 | 1722 | $2,250 | $1.31 | 21d | 1 | 0.72mi |
Listing history 11 events
-
2026-06-18days on market $325,000 Active 14 DOM
-
2026-06-17days on market $325,000 Active 13 DOM
-
2026-06-16days on market $325,000 Active 12 DOM
-
2026-06-15days on market $325,000 Active 11 DOM
-
2026-06-14days on market $325,000 Active 9 DOM
-
2026-06-10days on market $325,000 Active 6 DOM
-
2026-06-09days on market $325,000 Active 5 DOM
-
2026-06-08days on market $325,000 Active 4 DOM
-
2026-06-07days on market $325,000 Active 3 DOM
-
2026-06-05remarks 452-char remark
-
2026-06-05$325,000 Active 1 DOM
ⓘ Source: listings_history table (triggers on properties + properties_extension) + one-shot
backfill from property_details.listing_events for pre-trigger history.
Tax reassessment forecast NY · Partial reset (capped growth)
- Current annual tax
- $6,620 · $552/mo
- Projected year-2 tax
- $6,620 · $552/mo
- Expected delta
- $0/yr ($0/mo · 0.0%)
ⓘ Screening estimate from a state-policy table — verify with the county assessor before closing.
Climate risk First Street
- Flood 1/10 Low FEMA zone X (unshaded) · 0% chance over 30 yrs
- Wildfire 5/10 Major
- Heat 4/10 Moderate 7 d/yr ≥96°F today · 15 d/yr by 30 yrs out
- Wind 4/10 Moderate 15% chance of damaging wind over 30 yrs
- Air quality 2/10 Low 1 unhealthy d/yr today · 2 by 30 yrs out
Nearby sold comps map
Loading sold comps map…
Walkable amenities ~0.75 mi
Loading nearby amenities…
Taxation est. · year 1
- Rental income
- $44,271
- − Mortgage interest
- −$18,205
- − Property taxes
- −$6,620
- − Insurance
- −$1,625
- − Repairs & maintenance
- −$3,542
- − Management
- −$3,542
- − Depreciation
- −$9,455
- Taxable income
- $1,284
- Est. tax owed @ 24.0%
- −$308
- After-tax cash flow
- $5,970/yr
For passive investors: Depreciation is non-cash, so a rental often shows a tax loss while cash-flowing — sheltering income. Rental losses are passive: they offset passive income freely, and up to $25,000/yr can offset ordinary (W-2) income if you actively participate and your MAGI is under $100k (phasing out to $0 by $150k); unused losses carry forward. On sale, claimed depreciation is recaptured at up to 25%, and gains may owe capital-gains tax (a 1031 exchange can defer both). Figures are a year-1 estimate at your 24.0% rate — not tax advice; consult a CPA.
Schools (NCES district)
- District
- Monroe-Woodbury Central School District
- NCES district ID
- 3619650
- Math proficiency
- 50% ▼ -17.00%
- Reading proficiency
- 56% ▼ -1.00%
- Median HH income
- $104,681
- Composite
- 50.48/100
- National rank
- #1855
- State rank
- #250 of 590 in NY
Livability — Woodbury
- Score
- 66/100
- State rank
- #663
- US rank
- #11975
Category grades
Schools grade is shown separately in the Schools card above.
Census & demographics
- Census place
- Woodbury, NY
- County
- Orange County · 267,004 people
- City population
- 9,402
- Metro
- Poughkeepsie-Newburgh-Middletown, NY
- Population (ZIP)
- 9,569
- Household income
- $120,098
- Rent vs Own
- Severe rent burden
- 104.0
Population outlook (Orange County) Hauer SSP2
- Today (2025)
- 379,830 people
- By 2030
- 378,955 · -0.2%
- By 2040
- 375,444 · -1.2%
- By 2050
- 369,311 · -2.8%
- By 2075
- 354,233 · -6.7%
- By 2100
- 318,150 · -16.2%
Race, ethnicity, and origin ACS 2023
- Neighborhood character
- Diverse neighborhood (Simpson 0.64)
- Race & ethnicity
- White 52% Hispanic / Latino 27% Two or more races 16% Black 10% Asian 6%
- Hispanic origin (detail)
- Mexican 6% Puerto Rican 14% Dominican 5%
- Common ancestry
- Romanian 7% Scandinavian 2% Slovak 2%
- Foreign-born
- 14% · Canada, China, Jamaica
- Languages at home
- 81% English-only · Spanish 11% German/W. Germanic 4% Other Indo-European 2%
Political lean MEDSL · Orange
- 2024 margin
- Lean R (+8.4) · D 45.8% · R 54.2%
- 2008→2024 swing
- -12.5pp toward R · 2008: 4.1pp · 2024: -8.4pp
- All cycles
- 2024: R+8.4 2020: R+0.2 2016: R+6.5 2012: D+5.2 2008: D+4.1
Not yet ingested
- Civics
- —
Market trends
- HPI YoY
- ▼ -50.76%
- Current HPI
- 271.431
- Rent YoY
- —
- Metro
- Poughkeepsie-Newburgh-Middletown, NY
- State GDP YoY
- ▲ 2.60%
- F500 in state
- 92
Industry mix (Fortune 500 HQ in NY)
| Industry | F500 HQs | Revenue |
|---|---|---|
| Financial Services | 10 | $950B |
|
||
| Consumer Goods | 9 | $162B |
|
||
| Insurance | 4 | $225B |
|
||
| Telecommunications | 2 | $144B |
|
||
| Pharmaceuticals | 2 | $112B |
|
||
| Media / Entertainment | 2 | $69B |
|
||
Price history
1 event — show timeline
- 2026-06-04 Listed $325,000 OneKey® MLS as Distributed by MLS Grid
Property tax history
+5.1%/yrLatest (2025): $6,620 · +1.6% YoY. Source: county tax records.
Cash-flow waterfall
monthlySold comps — $/sqft
last 12 mo · ≤1 miLoading sold comps…