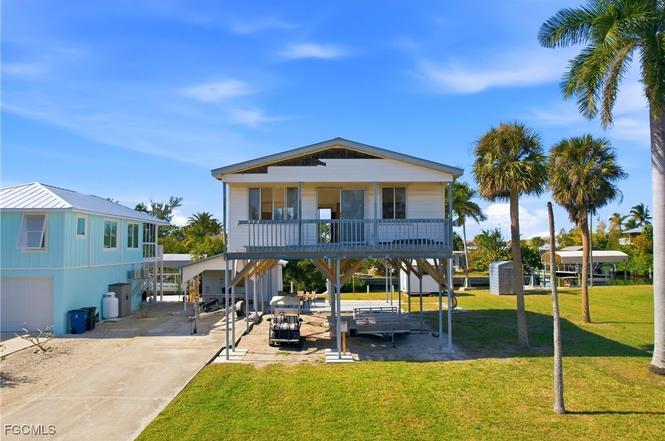
2661 Bamboo St
St. James City, FL 33956
$335,000C-
2 bd · 1.0 ba ·
832 sqft ·
Built 1958
· SingleFamily
· Active
· 90 DOM
Cashflow @ list (25.0% down · 7.5%)
Estimated rent
$3,256/mo
Mortgage (P&I)
−$1,757
Tax + insurance
−$837
HOA
−$0
Vac / Maint / Mgmt
−$684
Net cashflow
$-22/mo
Annual
$-263/yr
Cap rate
7.74%
Cash-on-cash
5.18%
DSCR
1.23
1% rule
0.97%
Cash to close
$93,800
Investor read
- This is a 2-bed/1.0-bath single-family listed at $335k.
- At list price, monthly cash flow is $-22 ($-263/yr) — negative.
- To cash-flow at today's rent, offer at most $331k (1.2% below list).
- To meet the 1% rule (rent ≥ 1% of price), the offer needs to be $326k (2.8% below list).
- It's been on market 90 days — a 6% lower offer ($315k) is reasonable based on typical stale-listing flexibility.
- Recommended offer: $315k (6.0% below list) — sets the bar for market timing.
- Local home prices are declining (-3.0%/yr); year-one equity from $2k of loan paydown is wiped out by about $10k of value loss. Plan a longer hold.
- Location reads: area grade C — affects rentability + tenant quality, not the cash-flow math above.
- Lee (suburban): math 47% / reading 50% proficiency, ranked #42 of 73 in FL (top 58%) — families likely to look elsewhere, expect single-tenant / working-renter base with shorter leases.
- Watch-outs: flood insurance adds $427/mo; built in 1958 — expect roof / HVAC / electrical / plumbing capex.
- Market conditions: 287 active listings in the ZIP; 3 comparable units currently listed for rent nearby; rentals at typical pace (median 24d on market — plan ~3-4 weeks tenant-placement turnaround); 15,411 units permitted in Lee County in 2024 (4,686 in 5+ unit buildings).
- Lee County population projected at +44% by 2050 — long-run rental-demand tailwind backs the buy-and-hold thesis.
- 2 sale attempts; this cycle's ask has dropped $50k (13%) from the opening price — seller is motivated, your offer sets the floor, not the list.
- Climate carrying-cost: in FEMA flood zone AE (mandatory federal flood insurance); severe wind risk, 99% chance of damaging wind over 30y; extreme-heat days projected 7→27/yr by 2055 (HVAC capex compounding) — expect insurance premiums to compound above CPI over the hold.
- Cap rate 7.7% vs local median 4.9% in St. James City — top-decile yield for the area; either an underpriced asset or a hidden risk that comps aren't pricing in. Stress-test before assuming the spread holds.
Questions for listing agent
- What do current leases actually rent for vs. the listed asking? Can we see a recent rent roll and the last 12 months of T-12 income?
- It's been on market 90 days. Have you received any prior offers? Is the seller open to a 6% concession, seller financing, or rate buy-down credit?
- Built in 1958 — when were the roof, HVAC, electrical panel, plumbing, and water heater last replaced?
- What's the actual annual flood-insurance premium (NFIP or private), and is the property in a SFHA with mandatory coverage?
- Why hasn't it sold? Are there any deal-killer items the seller is aware of (foundation, flood, title, zoning, code violations)?
- Is there a deadline driving the sale (1031 exchange, divorce, estate, relocation)? That informs how much negotiation room exists.
- What's the average days-on-market for RENTAL listings here right now (not sales)? A rising rental-DOM trend means longer vacancies and softer asking-rent achievability than the comps imply.
- What's the recent tenant-quality profile in this submarket — average credit score on applications, eviction rate, late-payment / NSF rate, and stable-employment percentage? A property-management company in the area should have these aggregated.
CashFlowRE · CFR-PSK4VZ51QS76CP
· Data 3 days ago
cashflowre.app · 2026-05-29