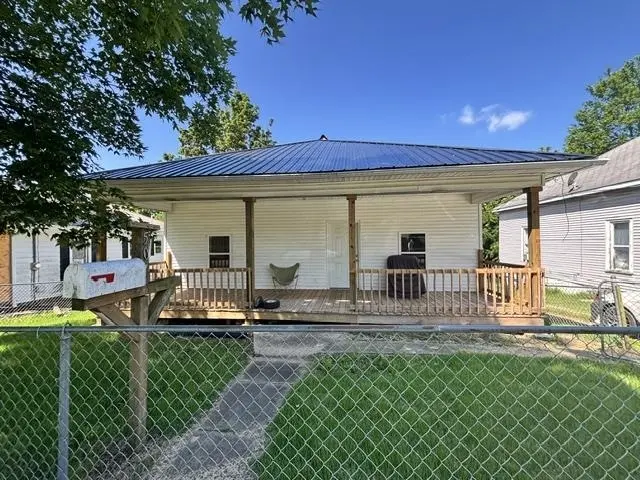
507 N 2nd St
Central City, KY 42330
$70,000C-
2 bd · 1.0 ba ·
1,040 sqft ·
Built 1950
· Other
· Active
· 2 DOM
Cashflow @ list (25.0% down · 7.5%)
Estimated rent
$650/mo
Mortgage (P&I)
−$367
Tax + insurance
−$43
HOA
−$0
Vac / Maint / Mgmt
−$136
Net cashflow
$103/mo
Annual
$1,240/yr
Cap rate
8.06%
Cash-on-cash
6.33%
DSCR
1.28
1% rule
0.93%
Cash to close
$19,600
Investor read
- This is a 2-bed/1.0-bath other listed at $70k.
- At list price, monthly cash flow is $103 ($1k/yr) — positive.
- The deal already cash-flows at list — no discount required.
- To meet the 1% rule (rent ≥ 1% of price), the offer needs to be $65k (7.1% below list).
- Only 2 days on market — expect competitive offers; lowballing is unlikely to land.
- Recommended offer: $65k (7.1% below list) — sets the bar for 1% rule.
- Local home prices are declining (-3.0%/yr); year-one equity from $484 of loan paydown is wiped out by about $2k of value loss. Plan a longer hold.
- Location reads 66/100 on livability (#238 in KY) — a middle-class / working-renter tenant base. Strengths: crime A+, cost of living A+, housing A+; Watch: amenities F, commute F, health & safety F.
- Muhlenberg County (rural): math 24% / reading 37% proficiency, ranked #104 of 165 in KY (top 63%) — families likely to look elsewhere, expect single-tenant / working-renter base with shorter leases.
- Zoned schools: Central City Elementary (math 22% / reading 32%, grade F, #434 of 676 statewide, top 69%, 414 students, 73% FRL); Muhlenberg County High School (math 24% / reading 32%, grade F, #151 of 254 statewide, top 61%, 1,146 students, 53% FRL).
- Watch-outs: built in 1950 — expect roof / HVAC / electrical / plumbing capex.
- Market conditions: 40 active listings in the ZIP; 1 comparable units currently listed for rent nearby; 5 units permitted in Muhlenberg County in 2024 (0 in 5+ unit buildings).
- Muhlenberg County population projected at -12% by 2050 — secular population decline; favor cash flow + early exit over multi-decade hold.
- Current owner paid $18k; list at $70k implies a 289% gain — meaningful room to come down on a strong offer.
- Climate carrying-cost: extreme-heat days projected 7→20/yr by 2055 (HVAC capex compounding) — expect insurance premiums to compound above CPI over the hold.
- Cap rate 8.1% vs local median 4.0% in Central City — top-decile yield for the area; either an underpriced asset or a hidden risk that comps aren't pricing in. Stress-test before assuming the spread holds.
Questions for listing agent
- Built in 1950 — when were the roof, HVAC, electrical panel, plumbing, and water heater last replaced?
- Is there a deadline driving the sale (1031 exchange, divorce, estate, relocation)? That informs how much negotiation room exists.
- Schools are D-rated, which usually means shorter tenancies and higher turnover. Who's the typical renter profile here, and what's been the actual vacancy rate?
- What's the average days-on-market for RENTAL listings here right now (not sales)? A rising rental-DOM trend means longer vacancies and softer asking-rent achievability than the comps imply.
- What's the recent tenant-quality profile in this submarket — average credit score on applications, eviction rate, late-payment / NSF rate, and stable-employment percentage? A property-management company in the area should have these aggregated.
- How much new for-sale + rental construction is in the pipeline within 1–3 miles? Heavy new supply typically softens prices + rents 12–24 months out; constrained supply supports both.
CashFlowRE · CFR-PT3A707KPDQD97
· Data 2 days ago
cashflowre.app · 2026-05-29