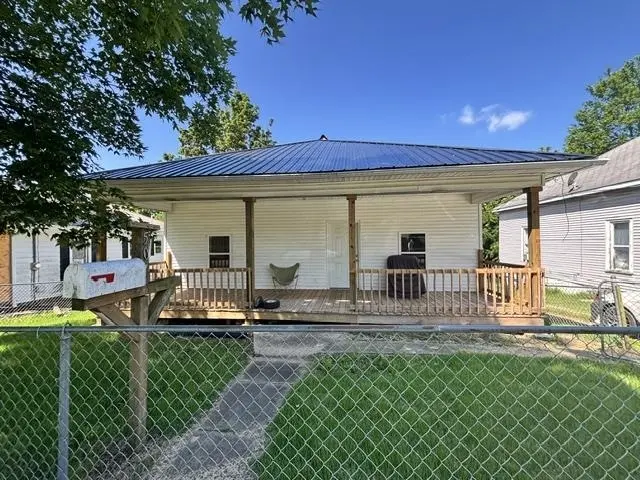
507 N 2nd St · Central City, KY
Flood risk 1/10 · Minimal
- FEMA flood zone
- X (unshaded)
- Chance of flooding over 30 yrs
- 0.0%
- Est. flood insurance / yr
- $507 – $1,088
Fire risk 4/10 · Minor
- Est. fire insurance / yr
- $839 – $1,559
Heat risk 5/10 · Moderate
- Hot days now (above 107°F)
- 7 days/yr
- Hot days in 30 yrs
- 20 days/yr
Wind risk 3/10 · Minor
- Chance of severe wind over 30 yrs
- 6.0%
Air-quality risk 2/10 · Minimal
- Unhealthy air days now
- 1 days/yr
- Unhealthy air days in 30 yrs
- 1 days/yr
Risk factors via First Street. Map © Google.
Why this score? — see what drove the C- grade
The composite is a weighted blend of 9 inputs, each scored 0–100. Each bar is that input's sub-score; the figure is the points it added to the 100-point composite (weight × sub-score).
- Cash flow +21.4/30.0
- ARV discount +7.5/15.0
- DSCR +6.8/10.0
- 1% rule +4.3/10.0
- Livability +3.3/5.0
- Rent growth +2.5/5.0
- Schools +2.5/10.0
- Condition / age +2.5/5.0
- Appreciation +0.0/10.0
$70,000
🖨 Deal sheet 📄 Offer letter ✓ Due diligence
Listing remarks
Located approximately 1.5 miles from Central City exit; after getting off exit, go straight and subject property will be on left.
Key facts
- 8,712 sq ft lot
- 2 garage spots
- Built 1950
Property features AI
Finance
- Other: Approximately 0.2 acre lot
Exterior
- Parking: 2-car garage; Gravel parking
- Utilities: Public water; Natural gas available
- Home design: Single-family residence; Residential property
- Construction: Vinyl siding; Metal roof
- Exterior features: Covered porch; Deck
Interior
- Kitchen: Electric range
- Flooring: Carpet; Tile; Vinyl
- Bathrooms: 1 full bathroom (main level)
- Heating & cooling: Central heating (Natural Gas); Central air conditioning
- Interior features: Eat-in kitchen; All appliances included
- Laundry & utility: Washer; Dryer; Gas water heater
Neighborhood map
What this means for you Summary
Snapshot
- This is a 2-bed/1.0-bath other listed at $70k.
Deal economics
- At list price, monthly cash flow is $103 ($1k/yr) — positive.
- The deal already cash-flows at list — no discount required.
- To meet the 1% rule (rent ≥ 1% of price), the offer needs to be $65k (7.1% below list).
- Recommended offer: $65k (7.1% below list) — sets the bar for 1% rule.
- Cap rate 8.1% vs local median 4.0% in Central City — top-decile yield for the area; either an underpriced asset or a hidden risk that comps aren't pricing in. Stress-test before assuming the spread holds.
Location & tenants
- Location reads 66/100 on livability (#238 in KY) — a middle-class / working-renter tenant base. Strengths: crime A+, cost of living A+, housing A+; Watch: amenities F, commute F, health & safety F.
- Muhlenberg County (rural): math 24% / reading 37% proficiency, ranked #104 of 165 in KY (top 63%) — families likely to look elsewhere, expect single-tenant / working-renter base with shorter leases.
- Zoned schools: Central City Elementary (math 22% / reading 32%, grade F, #434 of 676 statewide, top 69%, 414 students, 73% FRL); Muhlenberg County High School (math 24% / reading 32%, grade F, #151 of 254 statewide, top 61%, 1,146 students, 53% FRL).
- Market conditions: 40 active listings in the ZIP; 1 comparable units currently listed for rent nearby; 5 units permitted in Muhlenberg County in 2024 (0 in 5+ unit buildings).
Forward outlook
- Local home prices are declining (-3.0%/yr); year-one equity from $484 of loan paydown is wiped out by about $2k of value loss. Plan a longer hold.
- Muhlenberg County population projected at -12% by 2050 — secular population decline; favor cash flow + early exit over multi-decade hold.
Negotiation context
- Only 2 days on market — expect competitive offers; lowballing is unlikely to land.
- Current owner paid $18k; list at $70k implies a 289% gain — meaningful room to come down on a strong offer.
Risks & watch-outs
- Watch-outs: built in 1950 — expect roof / HVAC / electrical / plumbing capex.
- Climate carrying-cost: extreme-heat days projected 7→20/yr by 2055 (HVAC capex compounding) — expect insurance premiums to compound above CPI over the hold.
Questions for the listing agent
- Built in 1950 — when were the roof, HVAC, electrical panel, plumbing, and water heater last replaced?
- Is there a deadline driving the sale (1031 exchange, divorce, estate, relocation)? That informs how much negotiation room exists.
- Schools are D-rated, which usually means shorter tenancies and higher turnover. Who's the typical renter profile here, and what's been the actual vacancy rate?
- What's the average days-on-market for RENTAL listings here right now (not sales)? A rising rental-DOM trend means longer vacancies and softer asking-rent achievability than the comps imply.
- What's the recent tenant-quality profile in this submarket — average credit score on applications, eviction rate, late-payment / NSF rate, and stable-employment percentage? A property-management company in the area should have these aggregated.
- How much new for-sale + rental construction is in the pipeline within 1–3 miles? Heavy new supply typically softens prices + rents 12–24 months out; constrained supply supports both.
Investment metrics
- 1% rule
- 0.93% ✗
- Cap rate
- 8.06%
- Cash-on-cash
- 6.33%
- DSCR
- 1.28
- GRM
- 9.0
CMA / ARV
No comps found within radius.
Projected returns pro-forma
-3.0% appreciation · 3.0% rent growth · sell at horizon
- IRR
- -6.6%
- Equity multiple
- 0.76×
- Total profit
- $-4,798
- Equity at exit
- $10,437
- IRR
- 2.9%
- Equity multiple
- 1.21×
- Total profit
- $4,152
- Equity at exit
- $6,052
Cash invested: $19,600 (down + closing). Projections, not guarantees.
Landlord ↔ Tenant lean methodology
- Overall (STATE)
- 83 Strongly Landlord-Friendly
- State Kentucky
- 83 Strongly Landlord-Friendly · R+16
- County
- — inherits STATE
- City
- — inherits STATE
ZIP-level market 42330
- Home prices YoY
- -8.4%
- Active inventory
- 40
- Price-to-rent
- 9.0×
Monthly cashflow live
- Estimated rent
- $650 medium interval (Pro) →
- Mortgage (P&I)
- −$367
- Tax from tax record
- −$14 /mo · $167/yr
- Insurance
- −$29
- HOA
- −$0
- Vacancy / Maint / Mgmt
- −$136
- Net cashflow
- $103
Break-even live
UW: 25.0% down · 7.5% · 30yr · 1.5% tax · 5.0% vac · 8.0% maint · 8.0% mgmt
Financing live
Cash to close
- Down payment
- $17,500
- Closing costs
- $2,100
- Reserves months
- —
- Total cash needed
- —
Loan-product check · same deal, 3 products live
Conventional
25% down · 7.5% · 30yr
- Down + closing
- —
- Monthly P&I
- —
- Monthly cashflow
- —
- DSCR
- —
- Eligible?
- —
Personal DTI + credit; lowest rate.
DSCR
20% down · 8.5% · 30yr
- Down + closing
- —
- Monthly P&I
- —
- Monthly cashflow
- —
- DSCR
- —
- Eligible?
- —
No personal income docs; deal must DSCR.
Hard money
10% down · 12.0% · 12mo
- Down + closing
- —
- Monthly P&I
- —
- Monthly cashflow
- —
- DSCR
- —
- Eligible?
- —
Short-term bridge; refi at stabilization.
Rent comps 1 comps
| Address | Beds | Baths | Sqft | Rent | $/sqft | DOM | Units | Dist |
|---|---|---|---|---|---|---|---|---|
| 1217 W Reservoir Ave Apt 08 Central City, KY | 2.0 | 1.0 | 700 | $650 | $0.93 | 44d | 1 | 1.43mi |
Listing history 3 events
-
2026-06-18days on market $70,000 Active 2 DOM
-
2026-06-18remarks 129-char remark
-
2026-06-18$70,000 Active 1 DOM
ⓘ Source: listings_history table (triggers on properties + properties_extension) + one-shot
backfill from property_details.listing_events for pre-trigger history.
Tax reassessment forecast KY · Resets to sale price
- Current annual tax
- $167 · $14/mo
- Projected year-2 tax
- $602 · $50/mo
- Expected delta
- +$435/yr (+$36/mo · 260.3%)
ⓘ Screening estimate from a state-policy table — verify with the county assessor before closing.
Climate risk First Street
- Flood 1/10 Low FEMA zone X (unshaded) · 0% chance over 30 yrs
- Wildfire 4/10 Moderate
- Heat 5/10 Major 7 d/yr ≥107°F today · 20 d/yr by 30 yrs out
- Wind 3/10 Moderate 6% chance of damaging wind over 30 yrs
- Air quality 2/10 Low 1 unhealthy d/yr today · 1 by 30 yrs out
Nearby sold comps map
Loading sold comps map…
Walkable amenities ~0.75 mi
Loading nearby amenities…
Taxation est. · year 1
- Rental income
- $7,800
- − Mortgage interest
- −$3,921
- − Property taxes
- −$167
- − Insurance
- −$350
- − Repairs & maintenance
- −$624
- − Management
- −$624
- − Depreciation
- −$2,036
- Taxable income
- $77
- Est. tax owed @ 24.0%
- −$19
- After-tax cash flow
- $1,221/yr
For passive investors: Depreciation is non-cash, so a rental often shows a tax loss while cash-flowing — sheltering income. Rental losses are passive: they offset passive income freely, and up to $25,000/yr can offset ordinary (W-2) income if you actively participate and your MAGI is under $100k (phasing out to $0 by $150k); unused losses carry forward. On sale, claimed depreciation is recaptured at up to 25%, and gains may owe capital-gains tax (a 1031 exchange can defer both). Figures are a year-1 estimate at your 24.0% rate — not tax advice; consult a CPA.
Schools (NCES district)
- District
- Muhlenberg County
- NCES district ID
- 2100081
- Math proficiency
- 24% ▼ -26.00%
- Reading proficiency
- 37% ▼ -22.00%
- Median HH income
- $38,513
- Composite
- 25.47/100
- National rank
- #7444
- State rank
- #104 of 165 in KY
Livability — Central City
- Score
- 66/100
- State rank
- #238
- US rank
- #11651
Category grades
Schools grade is shown separately in the Schools card above.
Census & demographics
- Census place
- Central City, KY
- Population (ZIP)
- 9,354
Population outlook (Muhlenberg County) Hauer SSP2
- Today (2025)
- 30,114 people
- By 2030
- 29,347 · -2.5%
- By 2040
- 27,828 · -7.6%
- By 2050
- 26,359 · -12.5%
- By 2075
- 23,095 · -23.3%
- By 2100
- 19,709 · -34.6%
Race, ethnicity, and origin ACS 2023
- Neighborhood character
- Predominantly White (91%)
- Race & ethnicity
- White 91% Two or more races 5% Black 3% Hispanic / Latino 2%
- Common ancestry
- Slovak 2% Lithuanian 1% Serbian 1%
- Foreign-born
- 2% · Canada
- Languages at home
- 96% English-only · Spanish 2% German/W. Germanic 1%
Political lean MEDSL · Muhlenberg
- 2024 margin
- Solid R (+54.4) · D 22.3% · R 76.6% · Other 1.1%
- 2008→2024 swing
- -52.6pp toward R · 2008: -1.8pp · 2024: -54.4pp
- All cycles
- 2024: R+54.4 2020: R+48.8 2016: R+46.9 2012: R+23.5 2008: R+1.8
Not yet ingested
- Civics
- —
Market trends
- HPI YoY
- ▼ -17.10%
- Current HPI
- 185.6763
- Rent YoY
- —
- Metro
- —
- State GDP YoY
- ▲ 1.81%
- F500 in state
- 4
Industry mix (Fortune 500 HQ in KY)
| Industry | F500 HQs | Revenue |
|---|---|---|
| Healthcare | 1 | $118B |
|
||
| Food / Beverage | 1 | $7B |
|
||
Price history
+288.9% since first listed2 events — show timeline
- 2026-06-16 Listed $70,000 RASKMLS
- 2012-12-01 Sold (Public Records) $18,000 Public Records
Property tax history
+0.2%/yrLatest (2025): $167 · -1.1% YoY. Source: county tax records.
Cash-flow waterfall
monthlySold comps — $/sqft
last 12 mo · ≤1 miLoading sold comps…