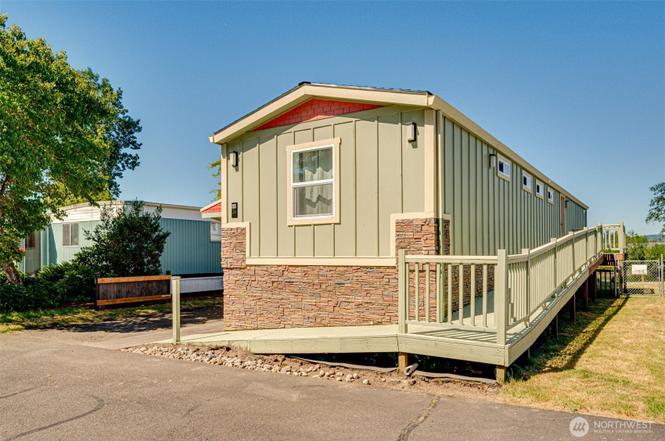
39100 NW Pacific Hwy NW #36
Woodland, WA 98674
$200,000D
2 bd · 2.0 ba ·
924 sqft ·
Built 1994
· Manufactured
· Active
· 1 DOM
Cashflow @ list (25.0% down · 7.5%)
Estimated rent
$1,750/mo
Mortgage (P&I)
−$1,049
Tax + insurance
−$760
HOA
−$0
Vac / Maint / Mgmt
−$368
Net cashflow
$-426/mo
Annual
$-5,111/yr
Cap rate
6.30%
Cash-on-cash
0.01%
DSCR
1.00
1% rule
0.88%
Cash to close
$56,000
Investor read
- This is a 2-bed/2.0-bath manufactured listed at $200k.
- At list price, monthly cash flow is $-426 ($-5k/yr) — negative.
- To cash-flow at today's rent, offer at most $138k (30.8% below list).
- To meet the 1% rule (rent ≥ 1% of price), the offer needs to be $175k (12.5% below list).
- Only 1 days on market — expect competitive offers; lowballing is unlikely to land.
- Recommended offer: $138k (30.8% below list) — sets the bar for cash-flow.
- Local home prices are declining (-3.0%/yr); year-one equity from $1k of loan paydown is wiped out by about $6k of value loss. Plan a longer hold.
- Location reads 77/100 on livability (#152 in WA, #3,252 nationally) — a middle-class / working-renter tenant base. Strengths: housing A+, health & safety A+, amenities B+; Watch: commute F.
- Woodland School District (town): math 48% / reading 62% proficiency, ranked #94 of 291 in WA (top 32%) — acceptable for families but not a draw, mixed tenant base, ~2y average lease.
- Zoned schools: Columbia Elementary School (428 students, 54% FRL); Woodland Middle School (682 students, 49% FRL); Woodland High School (658 students, 42% FRL).
- Watch-outs: flood insurance adds $427/mo.
- Market conditions: 222 active listings in the ZIP; 6 comparable units currently listed for rent nearby; rentals lingering (median 46d on market — plan ~5-8 weeks vacancy on turnover, expect pricing pressure); 67% of comp listings sitting > 30 days — soft ceiling on asking rent; solid renter incomes; 3,547 units permitted in Clark County in 2024 (1,361 in 5+ unit buildings).
- Clark County population projected at +29% by 2050 — long-run rental-demand tailwind backs the buy-and-hold thesis.
- Climate carrying-cost: in FEMA flood zone AE (mandatory federal flood insurance) — expect insurance premiums to compound above CPI over the hold.
- Cap rate 6.3% vs local median 2.7% in Woodland — top-decile yield for the area; either an underpriced asset or a hidden risk that comps aren't pricing in. Stress-test before assuming the spread holds.
Questions for listing agent
- What do current leases actually rent for vs. the listed asking? Can we see a recent rent roll and the last 12 months of T-12 income?
- What's the actual annual flood-insurance premium (NFIP or private), and is the property in a SFHA with mandatory coverage?
- Is there a deadline driving the sale (1031 exchange, divorce, estate, relocation)? That informs how much negotiation room exists.
- Schools are D-rated, which usually means shorter tenancies and higher turnover. Who's the typical renter profile here, and what's been the actual vacancy rate?
- The area grade is low — what's the realistic commute time and amenity access for the typical tenant pool here? Any planned neighborhood developments (good or bad) we should know about?
- What's the average days-on-market for RENTAL listings here right now (not sales)? A rising rental-DOM trend means longer vacancies and softer asking-rent achievability than the comps imply.
- What's the recent tenant-quality profile in this submarket — average credit score on applications, eviction rate, late-payment / NSF rate, and stable-employment percentage? A property-management company in the area should have these aggregated.
- How much new for-sale + rental construction is in the pipeline within 1–3 miles? Heavy new supply typically softens prices + rents 12–24 months out; constrained supply supports both.
CashFlowRE · CFR-PTP1ANFVVZMAVG
· Data 8 h ago
cashflowre.app · 2026-05-29