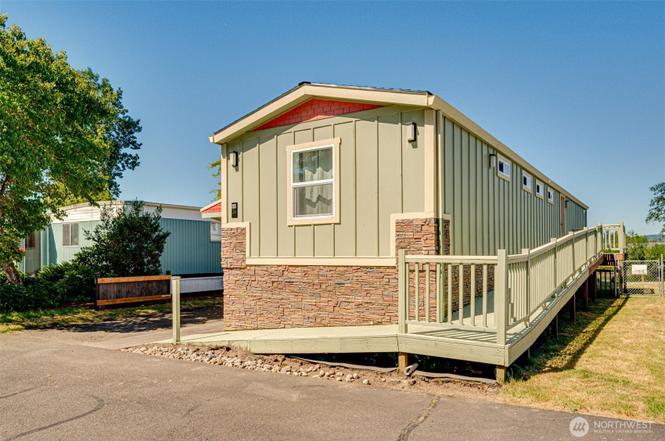
39100 NW Pacific Hwy NW #36 · Woodland, WA
Flood risk 9/10 · Severe
- FEMA flood zone
- AE
- Chance of flooding over 30 yrs
- 0.99%
- Est. flood insurance / yr
- $1,737 – $8,500
Fire risk 4/10 · Minor
- Est. fire insurance / yr
- $604 – $1,122
Heat risk 2/10 · Minimal
- Hot days now (above 91°F)
- 7 days/yr
- Hot days in 30 yrs
- 14 days/yr
Wind risk 1/10 · Minimal
- Chance of severe wind over 30 yrs
- —
Air-quality risk 8/10 · Major
- Unhealthy air days now
- 9 days/yr
- Unhealthy air days in 30 yrs
- 11 days/yr
Risk factors via First Street. Map © Google.
Why this score? — see what drove the D grade
The composite is a weighted blend of 9 inputs, each scored 0–100. Each bar is that input's sub-score; the figure is the points it added to the 100-point composite (weight × sub-score).
- Cash flow +13.3/30.0
- ARV discount +7.5/15.0
- Schools +5.0/10.0
- DSCR +4.0/10.0
- Livability +3.9/5.0
- 1% rule +3.8/10.0
- Rent growth +2.5/5.0
- Condition / age +2.5/5.0
- Appreciation +0.0/10.0
$200,000
🖨 Deal sheet (PDF) 📄 Offer letter ✓ Due diligence
Listing remarks
Rare opportunity to own a beautifully remodeled manufactured home in a highly sought-after riverfront setting! Spaces like this seldom come available, with breathtaking river views and fishing right from your backyard. The true value is not only in the home itself but in securing one of the most desirable riverfront spaces in the park. This home has been completely transformed from the studs out with exceptional attention to detail and quality craftsmanship throughout. Features include updated flooring, cabinetry, countertops, appliances, fixtures, and finishes, creating a modern, move-in-ready living space that feels like a brand-new home. Enjoy your morning coffee or evening sunsets from
Key facts
- Updated flooring
- Riverfront setting
- Updated cabinetry
Tags
Property features AI
Finance
- Other: Calculated building area: 924 square feet; Lot dimensions: 35 x 100 feet; Lot size units: square feet; Elevation units: feet; Directions: Turn at ampm, cross Lewis River Bridge, stay right at the fork and take the 3rd entrance to park
- Financial info: Cash offers only
- HOA & community: Park name: Woodland MHC LLC; 72 homes in the park; Pets allowed; Park approved for sale; Land lease: $850
Exterior
- Parking: Carport; Uncovered parking; Carport included
- Utilities: Community water (Woodland MHC LLC); Septic sewer; Electric power (Clark PUD); Cable: Xfinity; Internet: Xfinity
- Home design: Manufactured home (single wide); Made by Liberty Homes, model KG147014; Single-story; West-facing; Entry: pillar/post/pier foundation; Mobile home remains on site
- Construction: Cement construction materials; Composition roof; Manufactured after 06/15/1976
- Exterior features: Cement/concrete exterior; Patio/porch/deck; Walk-in closet; On waterfront; Paved lot; Park amenities: common area, community waterfront, RV parking
Interior
- Kitchen: Dishwasher; Microwave; Refrigerator; Stove/Range
- Bedrooms: 2 bedrooms
- Flooring: Laminate flooring
- Bathrooms: 2 full bathrooms; 2 bathtubs; 2 showers
- Heating & cooling: Forced air heating; Has cooling; Electric energy source
- Interior features: Kitchen with eating space; Living room; Accessible approach with ramp; Updated/remodeled
- Laundry & utility: Washer; Dryer; Water heater in closet
Neighborhood map
What this means for you Summary
Snapshot
- This is a 2-bed/2.0-bath manufactured listed at $200k.
Deal economics
- At list price, monthly cash flow is $-426 ($-5k/yr) — negative.
- To cash-flow at today's rent, offer at most $138k (30.8% below list).
- To meet the 1% rule (rent ≥ 1% of price), the offer needs to be $175k (12.5% below list).
- Recommended offer: $138k (30.8% below list) — sets the bar for cash-flow.
- Cap rate 6.3% vs local median 2.7% in Woodland — top-decile yield for the area; either an underpriced asset or a hidden risk that comps aren't pricing in. Stress-test before assuming the spread holds.
Location & tenants
- Location reads 77/100 on livability (#152 in WA, #3,252 nationally) — a middle-class / working-renter tenant base. Strengths: housing A+, health & safety A+, amenities B+; Watch: commute F.
- Woodland School District (town): math 48% / reading 62% proficiency, ranked #94 of 291 in WA (top 32%) — acceptable for families but not a draw, mixed tenant base, ~2y average lease.
- Zoned schools: Columbia Elementary School (428 students, 54% FRL); Woodland Middle School (682 students, 49% FRL); Woodland High School (658 students, 42% FRL).
- Market conditions: 222 active listings in the ZIP; 6 comparable units currently listed for rent nearby; rentals lingering (median 46d on market — plan ~5-8 weeks vacancy on turnover, expect pricing pressure); 67% of comp listings sitting > 30 days — soft ceiling on asking rent; solid renter incomes; 3,547 units permitted in Clark County in 2024 (1,361 in 5+ unit buildings).
Forward outlook
- Local home prices are declining (-3.0%/yr); year-one equity from $1k of loan paydown is wiped out by about $6k of value loss. Plan a longer hold.
- Clark County population projected at +29% by 2050 — long-run rental-demand tailwind backs the buy-and-hold thesis.
Negotiation context
- Only 1 days on market — expect competitive offers; lowballing is unlikely to land.
Risks & watch-outs
- Watch-outs: flood insurance adds $427/mo.
- Climate carrying-cost: in FEMA flood zone AE (mandatory federal flood insurance) — expect insurance premiums to compound above CPI over the hold.
Questions for the listing agent
- What do current leases actually rent for vs. the listed asking? Can we see a recent rent roll and the last 12 months of T-12 income?
- What's the actual annual flood-insurance premium (NFIP or private), and is the property in a SFHA with mandatory coverage?
- Is there a deadline driving the sale (1031 exchange, divorce, estate, relocation)? That informs how much negotiation room exists.
- Schools are D-rated, which usually means shorter tenancies and higher turnover. Who's the typical renter profile here, and what's been the actual vacancy rate?
- The area grade is low — what's the realistic commute time and amenity access for the typical tenant pool here? Any planned neighborhood developments (good or bad) we should know about?
- What's the average days-on-market for RENTAL listings here right now (not sales)? A rising rental-DOM trend means longer vacancies and softer asking-rent achievability than the comps imply.
- What's the recent tenant-quality profile in this submarket — average credit score on applications, eviction rate, late-payment / NSF rate, and stable-employment percentage? A property-management company in the area should have these aggregated.
- How much new for-sale + rental construction is in the pipeline within 1–3 miles? Heavy new supply typically softens prices + rents 12–24 months out; constrained supply supports both.
Investment metrics
- 1% rule
- 0.88% ✗
- Cap rate
- 6.30%
- Cash-on-cash
- 0.01%
- DSCR
- 1.00
- GRM
- 9.5
CMA / ARV
- ARV (on-the-fly)
- $94,248
- Comps found
- 2
Show comp detail 2 sales within ~0.75 mi
| Address | Dist | Beds/Ba | Sqft | Sold | Price | $/sf | Match |
|---|---|---|---|---|---|---|---|
| 39100 NW Pacific Hwy #29 | 0.00mi | 2/2.0 | 924 (0%) | 23mo | $94,000 | $102 | 81 |
| 296 Island Aire Dr #16 | 0.43mi | 2/2.0 | 924 (0%) | 24mo | $80,000 | $87 | 60 |
Match score weights: distance 35% · size 25% · config 20% · recency 20%. Top-matched comps best support the ARV.
Projected returns pro-forma
-3.0% appreciation · 3.0% rent growth · sell at horizon
- IRR
- -32.3%
- Equity multiple
- -0.06×
- Total profit
- $-59,245
- Equity at exit
- $29,821
- IRR
- -36.3%
- Equity multiple
- -0.52×
- Total profit
- $-85,344
- Equity at exit
- $17,292
Cash invested: $56,000 (down + closing). Projections, not guarantees.
Landlord ↔ Tenant lean methodology
- Overall (STATE)
- 28 Tenant-Leaning
- State Washington
- 28 Tenant-Leaning · D+8
- County
- — inherits STATE
- City
- — inherits STATE
ZIP-level market 98674
- Home prices YoY
- -21.8%
- Active inventory
- 222
- Price-to-rent
- 9.5×
Monthly cashflow live
- Estimated rent
- $1,750 high interval (Pro) →
- Mortgage (P&I)
- −$1,049
- Tax est. 1.5%
- −$250 /mo · $3,000/yr
- Insurance
- −$83
- Flood insurance flood zone
- −$427 /mo · $5,118/yr
- HOA
- −$0
- Vacancy / Maint / Mgmt
- −$368
- Net cashflow
- $-426
Break-even live
Sensitivity live
| Price | -10% $-288 | -5% $-357 | +0% $-426 | +5% $-495 | +10% $-564 |
|---|---|---|---|---|---|
| Rent | -10% $-564 | -5% $-495 | +0% $-426 | +5% $-357 | +10% $-288 |
| Rate | -1.0pp $-325 | -0.5pp $-375 | base $-426 | +0.5pp $-478 | +1.0pp $-530 |
UW: 25.0% down · 7.5% · 30yr · 1.5% tax · 5.0% vac · 8.0% maint · 8.0% mgmt
Financing live
Cash to close
- Down payment
- $50,000
- Closing costs
- $6,000
- Reserves months
- —
- Total cash needed
- —
Loan-product check · same deal, 3 products live
Conventional
25% down · 7.5% · 30yr
- Down + closing
- —
- Monthly P&I
- —
- Monthly cashflow
- —
- DSCR
- —
- Eligible?
- —
Personal DTI + credit; lowest rate.
DSCR
20% down · 8.5% · 30yr
- Down + closing
- —
- Monthly P&I
- —
- Monthly cashflow
- —
- DSCR
- —
- Eligible?
- —
No personal income docs; deal must DSCR.
Hard money
10% down · 12.0% · 12mo
- Down + closing
- —
- Monthly P&I
- —
- Monthly cashflow
- —
- DSCR
- —
- Eligible?
- —
Short-term bridge; refi at stabilization.
Rent comps 6 comps
| Address | Beds | Baths | Sqft | Rent | $/sqft | DOM | Units | Dist |
|---|---|---|---|---|---|---|---|---|
| 1451 N Goerig St Unit 1459-5 Woodland, WA | 2.0 | 2.0 | 1048 | $1,450 | $1.38 | 4d | 1 | 0.58mi |
| 1451 N Goerig St Unit 1459-4 Woodland, WA | 1.0 | 1.0 | 758 | $1,275 | $1.68 | 45d | 1 | 0.58mi |
| 1473 N Goerig St Woodland, WA | 1.0–2.0 | 1.0 | 800 | $1,520 | $1.90 | 0d | 4 | 0.61mi |
| 612 5th St Unit 103 Woodland, WA | 2.0 | 1.0 | 825 | $1,550 | $1.88 | 45d | 1 | 0.71mi |
| 612 5th St Unit 201 Woodland, WA | 1.0 | 1.0 | 651 | $1,350 | $2.07 | 45d | 1 | 0.71mi |
| 560 Bozarth Ave Unit B 201 Woodland, WA | 2.0 | 1.0 | 850 | $1,550 | $1.82 | 45d | 1 | 0.73mi |
Listing history 2 events
-
2026-06-22remarks 699-char remark
-
2026-06-22$200,000 Active 1 DOM
ⓘ Source: listings_history table (triggers on properties + properties_extension) + one-shot
backfill from property_details.listing_events for pre-trigger history.
Climate risk First Street
- Flood 9/10 Extreme FEMA zone AE · 99% chance over 30 yrs
- Wildfire 4/10 Moderate
- Heat 2/10 Low 7 d/yr ≥91°F today · 14 d/yr by 30 yrs out
- Wind 1/10 Low
- Air quality 8/10 Severe 9 unhealthy d/yr today · 11 by 30 yrs out
Nearby sold comps map
Loading sold comps map…
Walkable amenities ~0.75 mi
Loading nearby amenities…
Taxation est. · year 1
- Rental income
- $21,005
- − Mortgage interest
- −$11,203
- − Property taxes
- −$3,000
- − Insurance
- −$6,118
- − Repairs & maintenance
- −$1,680
- − Management
- −$1,680
- − Depreciation
- −$5,818
- Taxable loss
- −$8,496
- Est. tax savings @ 24.0%
- +$2,039
- After-tax cash flow
- $-3,072/yr
For passive investors: Depreciation is non-cash, so a rental often shows a tax loss while cash-flowing — sheltering income. Rental losses are passive: they offset passive income freely, and up to $25,000/yr can offset ordinary (W-2) income if you actively participate and your MAGI is under $100k (phasing out to $0 by $150k); unused losses carry forward. On sale, claimed depreciation is recaptured at up to 25%, and gains may owe capital-gains tax (a 1031 exchange can defer both). Figures are a year-1 estimate at your 24.0% rate — not tax advice; consult a CPA.
Schools (NCES district)
- District
- Woodland School District
- NCES district ID
- 5310050
- Math proficiency
- 48% ▲ 4.00%
- Reading proficiency
- 62% ▲ 4.00%
- Median HH income
- $60,973
- Composite
- 49.77/100
- National rank
- #4219
- State rank
- #94 of 291 in WA
Livability — Woodland
- Score
- 77/100
- State rank
- #152
- US rank
- #3252
Category grades
Schools grade is shown separately in the Schools card above.
Census & demographics
- County
- Clark County · 513,189 people
- City population
- 17,525
- Metro
- Longview, WA
- Population (ZIP)
- 17,525
- Household income
- $94,245
- Rent vs Own
- Severe rent burden
- 209.0
Population outlook (Clark County) Hauer SSP2
- Today (2025)
- 529,610 people
- By 2030
- 563,242 · +6.4%
- By 2040
- 625,905 · +18.2%
- By 2050
- 681,558 · +28.7%
- By 2075
- 805,967 · +52.2%
- By 2100
- 877,450 · +65.7%
Race, ethnicity, and origin ACS 2023
- Neighborhood character
- Predominantly White (79%)
- Race & ethnicity
- White 79% Hispanic / Latino 14% Two or more races 9% Black 1% Asian 1%
- Hispanic origin (detail)
- Mexican 10%
- Common ancestry
- Portuguese 4% Italian 3% Lithuanian 2%
- Foreign-born
- 7% · Canada, Jamaica
- Languages at home
- 86% English-only · Spanish 9% German/W. Germanic 2% French/Haitian/Cajun 1%
Political lean MEDSL · Clark
- 2024 margin
- Lean D (+7.0) · D 52.1% · R 45.1% · Other 2.8%
- 2008→2024 swing
- +0.9pp no change · 2008: 6.1pp · 2024: 7.0pp
- All cycles
- 2024: D+7.0 2020: D+5.1 2016: D+0.1 2012: D+0.1 2008: D+6.1
Not yet ingested
- Civics
- —
Market trends
- HPI YoY
- ▼ -92.68%
- Current HPI
- 333.4106
- Rent YoY
- —
- Metro
- Longview, WA
- State GDP YoY
- ▲ 4.65%
- F500 in state
- 22
Industry mix (Fortune 500 HQ in WA)
| Industry | F500 HQs | Revenue |
|---|---|---|
| Retail | 2 | $269B |
|
||
| Technology / Retail | 1 | $638B |
|
||
| Technology | 1 | $245B |
|
||
| Telecommunications | 1 | $38B |
|
||
| Food / Beverage | 1 | $36B |
|
||
| Automotive / Trucks | 1 | $34B |
|
||
Price history
1 event — show timeline
- 2026-06-19 Listed $200,000 NWMLS as Distributed by MLS Grid
Property tax history
+1.6%/yrLatest (2026): $114 · +54.3% YoY. Source: county tax records.
Cash-flow waterfall
monthlySold comps — $/sqft
last 12 mo · ≤1 miLoading sold comps…