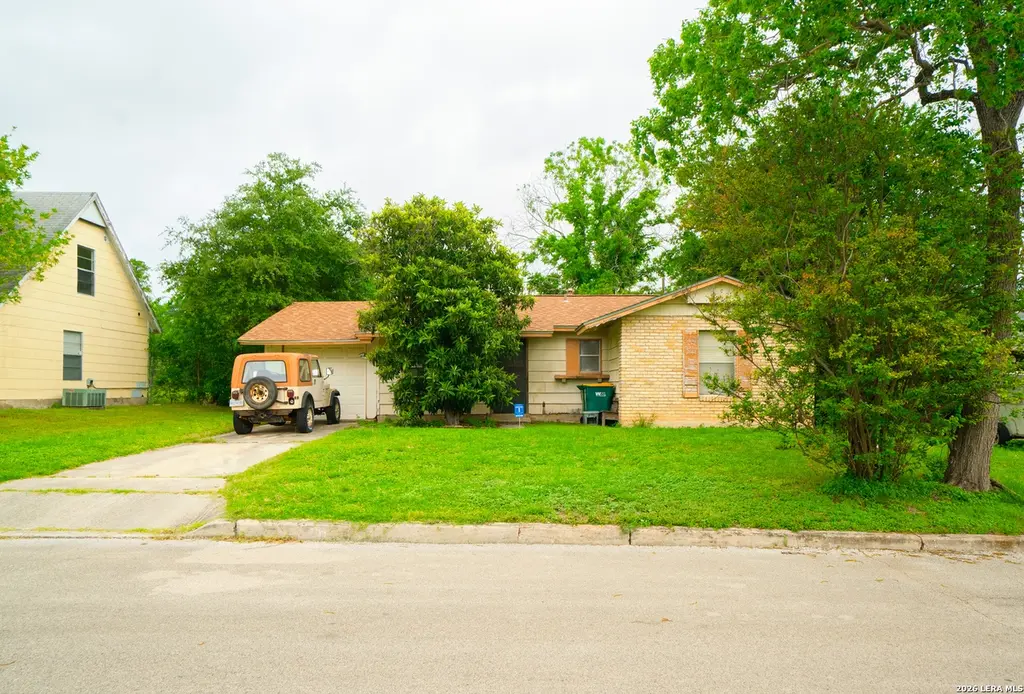
811 Stonegate Dr
Universal City, TX 78148
$120,000B-
3 bd · 1.0 ba ·
1,197 sqft ·
Built 1960
· SingleFamily
· Pending
· 12 DOM
Cashflow @ list (25.0% down · 7.5%)
Estimated rent
$1,373/mo
Mortgage (P&I)
−$629
Tax + insurance
−$238
HOA
−$0
Vac / Maint / Mgmt
−$288
Net cashflow
$217/mo
Annual
$2,603/yr
Cap rate
8.46%
Cash-on-cash
7.75%
DSCR
1.34
1% rule
1.14%
Cash to close
$33,600
Investor read
- This is a 3-bed/1.0-bath single-family listed at $120k.
- At list price, monthly cash flow is $217 ($3k/yr) — positive.
- The deal already cash-flows at list — no discount required.
- Meets the 1% rule at list price ($1k rent vs $120k).
- Only 12 days on market — expect competitive offers; lowballing is unlikely to land.
- Local home prices are declining (-3.0%/yr); year-one equity from $830 of loan paydown is wiped out by about $4k of value loss. Plan a longer hold.
- Location reads 74/100 on livability (#174 in TX, #4,608 nationally) — a middle-class / working-renter tenant base. Strengths: cost of living A+, housing A+, health & safety B; Watch: amenities F, commute F.
- Schertz-Cibolo-U City ISD (suburban): math 49% / reading 48% proficiency, ranked #152 of 826 in TX (top 18%) — families likely to look elsewhere, expect single-tenant / working-renter base with shorter leases.
- Zoned schools: Rose Garden El (math 32% / reading 36%, grade F, #2,149 of 4,322 statewide, top 50%, 902 students, 48% FRL); Samuel Clemens H S (math 45% / reading 60%, grade C-, #444 of 1,632 statewide, top 27%, 2,544 students, 30% FRL).
- Market conditions: Rents flat; 128 active listings in the ZIP; 40 comparable units currently listed for rent nearby; rentals at typical pace (median 21d on market — plan ~3-4 weeks tenant-placement turnaround); 8,308 units permitted in Bexar County in 2024 (2,506 in 5+ unit buildings).
- Bexar County population projected at +50% by 2050 — long-run rental-demand tailwind backs the buy-and-hold thesis.
- Climate carrying-cost: severe wind risk, 80% chance of damaging wind over 30y; extreme-heat days projected 7→22/yr by 2055 (HVAC capex compounding) — expect insurance premiums to compound above CPI over the hold.
- Cap rate 8.5% vs local median 3.1% in Universal City — top-decile yield for the area; either an underpriced asset or a hidden risk that comps aren't pricing in. Stress-test before assuming the spread holds.
Questions for listing agent
- Built in 1960 — when were the roof, HVAC, electrical panel, plumbing, and water heater last replaced?
- Is there a deadline driving the sale (1031 exchange, divorce, estate, relocation)? That informs how much negotiation room exists.
- What's the average days-on-market for RENTAL listings here right now (not sales)? A rising rental-DOM trend means longer vacancies and softer asking-rent achievability than the comps imply.
- What's the recent tenant-quality profile in this submarket — average credit score on applications, eviction rate, late-payment / NSF rate, and stable-employment percentage? A property-management company in the area should have these aggregated.
- How much new for-sale + rental construction is in the pipeline within 1–3 miles? Heavy new supply typically softens prices + rents 12–24 months out; constrained supply supports both.
CashFlowRE · CFR-PV0FJM4ERYAV1T
· Data 2 weeks ago
cashflowre.app · 2026-05-29