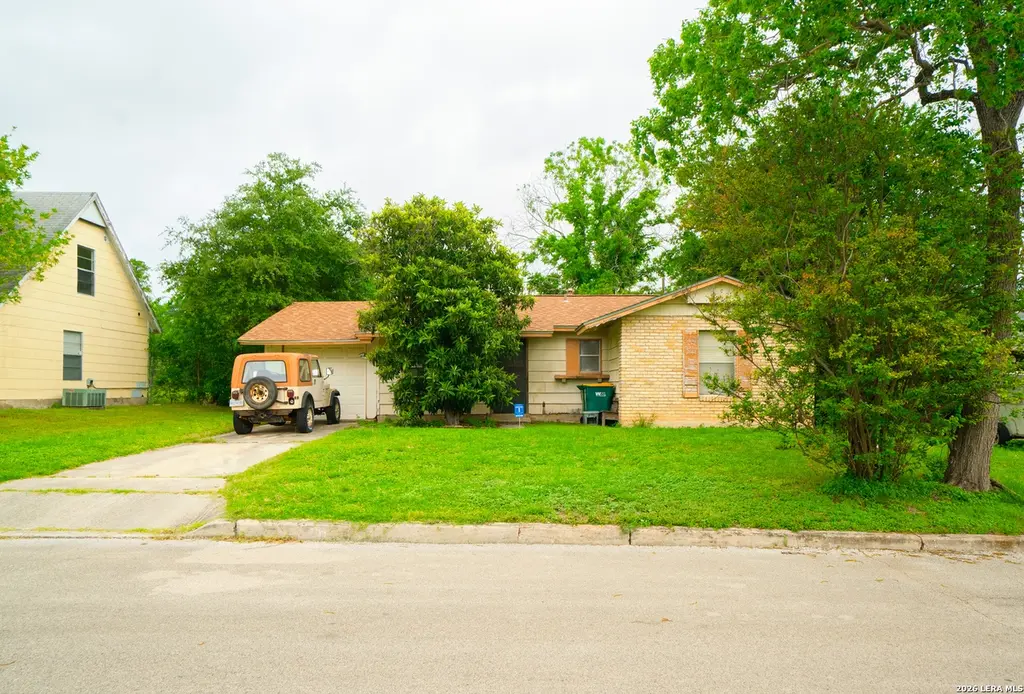
811 Stonegate Dr · Universal City, TX
Flood risk 1/10 · Minimal
- FEMA flood zone
- X (unshaded)
- Chance of flooding over 30 yrs
- 0.0%
- Est. flood insurance / yr
- $507 – $1,088
Fire risk 4/10 · Minor
- Est. fire insurance / yr
- $1,222 – $2,270
Heat risk 8/10 · Major
- Hot days now (above 108°F)
- 7 days/yr
- Hot days in 30 yrs
- 22 days/yr
Wind risk 8/10 · Major
- Chance of severe wind over 30 yrs
- 80.0%
Air-quality risk 2/10 · Minimal
- Unhealthy air days now
- 0 days/yr
- Unhealthy air days in 30 yrs
- 1 days/yr
Risk factors via First Street. Map © Google.
Why this score? — see what drove the B- grade
The composite is a weighted blend of 9 inputs, each scored 0–100. Each bar is that input's sub-score; the figure is the points it added to the 100-point composite (weight × sub-score).
- Cash flow +23.2/30.0
- ARV discount +15.0/15.0
- DSCR +7.4/10.0
- 1% rule +6.4/10.0
- Schools +4.4/10.0
- Livability +3.7/5.0
- Rent growth +2.6/5.0
- Condition / age +2.5/5.0
- Appreciation +0.0/10.0
$120,000
🖨 Deal sheet 📄 Offer letter ✓ Due diligence
Listing remarks
811 Stonegate Dr offers a great opportunity to make a home your own while already having several major improvements completed. Recent updates include plumbing improvements with a new sewer line, a newer hot water heater, a new roof, and an updated front entry. With some vision and personal touches, this home presents the chance to create a space that fits your style while benefiting from important big-ticket items already addressed. Conveniently located with easy access to shopping, dining, schools, and major highways.
Key facts
- Updated front entry
- New sewer line
- New roof
Tags
Property features AI
Finance
- HOA & community: Located in Old Rose Gardens subdivision
Exterior
- Parking: Attached 1-car garage
- Utilities: City water; City sewer; Electric service by CPS; Gas service by Entex; Garbage service by BFI; Water system and sewer system available
- Home design: Pre-owned single-family style; Brick and siding exterior; Slab foundation; Composition roof; Approximately 66 years old
- Construction: Brick exterior; Siding exterior; Slab foundation; Composition roof; Built about 66 years ago
- Exterior features: Patio slab; Chain link fence; Mature trees; City view; Street paved with curbs and streetlights
Interior
- Kitchen: Kitchen approximately 8 x 10; Stove/Range
- Bedrooms: Primary bedroom approximately 12 x 10; Second bedroom approximately 10 x 10; Third bedroom approximately 10 x 9
- Flooring: Carpeting; Linoleum
- Bathrooms: One full bathroom
- Heating & cooling: Electric heat; Multiple window air conditioners (3+); Other heating (see remarks)
- Interior features: Ceiling fans; Washer and dryer connections; Stove/Range; Gas water heater; Separate dining room; One living area; Ground level / no steps; Cable TV available; High-speed internet; Some window coverings remain
- Laundry & utility: Washer connection; Dryer connection
Neighborhood map
What this means for you Summary
Snapshot
- This is a 3-bed/1.0-bath single-family listed at $120k.
Deal economics
- At list price, monthly cash flow is $217 ($3k/yr) — positive.
- The deal already cash-flows at list — no discount required.
- Meets the 1% rule at list price ($1k rent vs $120k).
- Cap rate 8.5% vs local median 3.1% in Universal City — top-decile yield for the area; either an underpriced asset or a hidden risk that comps aren't pricing in. Stress-test before assuming the spread holds.
Location & tenants
- Location reads 74/100 on livability (#174 in TX, #4,608 nationally) — a middle-class / working-renter tenant base. Strengths: cost of living A+, housing A+, health & safety B; Watch: amenities F, commute F.
- Schertz-Cibolo-U City ISD (suburban): math 49% / reading 48% proficiency, ranked #152 of 826 in TX (top 18%) — families likely to look elsewhere, expect single-tenant / working-renter base with shorter leases.
- Zoned schools: Rose Garden El (math 32% / reading 36%, grade F, #2,149 of 4,322 statewide, top 50%, 902 students, 48% FRL); Samuel Clemens H S (math 45% / reading 60%, grade C-, #444 of 1,632 statewide, top 27%, 2,544 students, 30% FRL).
- Market conditions: Rents flat; 128 active listings in the ZIP; 40 comparable units currently listed for rent nearby; rentals at typical pace (median 21d on market — plan ~3-4 weeks tenant-placement turnaround); 8,308 units permitted in Bexar County in 2024 (2,506 in 5+ unit buildings).
Forward outlook
- Local home prices are declining (-3.0%/yr); year-one equity from $830 of loan paydown is wiped out by about $4k of value loss. Plan a longer hold.
- Bexar County population projected at +50% by 2050 — long-run rental-demand tailwind backs the buy-and-hold thesis.
Negotiation context
- Only 12 days on market — expect competitive offers; lowballing is unlikely to land.
Risks & watch-outs
- Climate carrying-cost: severe wind risk, 80% chance of damaging wind over 30y; extreme-heat days projected 7→22/yr by 2055 (HVAC capex compounding) — expect insurance premiums to compound above CPI over the hold.
Questions for the listing agent
- Built in 1960 — when were the roof, HVAC, electrical panel, plumbing, and water heater last replaced?
- Is there a deadline driving the sale (1031 exchange, divorce, estate, relocation)? That informs how much negotiation room exists.
- What's the average days-on-market for RENTAL listings here right now (not sales)? A rising rental-DOM trend means longer vacancies and softer asking-rent achievability than the comps imply.
- What's the recent tenant-quality profile in this submarket — average credit score on applications, eviction rate, late-payment / NSF rate, and stable-employment percentage? A property-management company in the area should have these aggregated.
- How much new for-sale + rental construction is in the pipeline within 1–3 miles? Heavy new supply typically softens prices + rents 12–24 months out; constrained supply supports both.
Investment metrics
- 1% rule
- 1.14% ✓
- Cap rate
- 8.46%
- Cash-on-cash
- 7.75%
- DSCR
- 1.34
- GRM
- 7.3
CMA / ARV
- ARV (on-the-fly)
- $197,505
- Comps found
- 12
Show comp detail 12 sales within ~0.75 mi
| Address | Dist | Beds/Ba | Sqft | Sold | Price | $/sf | Match |
|---|---|---|---|---|---|---|---|
| 838 Boulder Dr | 0.11mi | 3/2.0 | 1,242 (+4%) | 1mo | $249,500 | $201 | 84 |
| 827 Horseshoe | 0.14mi | 3/2.0 | 1,248 (+4%) | 8mo | $155,000 | $124 | 76 |
| 902 Cibolo Trl | 0.11mi | 4/1.0 (+1) | 1,147 (-4%) | 14mo | $189,000 | $165 | 71 |
| 430 W Byrd Blvd | 0.66mi | 3/1.0 | 1,208 (+1%) | 14mo | $175,000 | $145 | 56 |
| 915 Stonegate | 0.19mi | 4/2.0 (+1) | 1,344 (+12%) | 8mo | $187,000 | $139 | 55 |
| 173 National Blvd | 0.62mi | 3/2.0 | 1,230 (+3%) | 13mo | $189,990 | $154 | 52 |
| 229 E Langley Blvd | 0.57mi | 3/2.0 | 1,299 (+8%) | 5mo | $165,000 | $127 | 51 |
| 201 Trudy Ln | 0.51mi | 3/2.0 | 1,310 (+9%) | 8mo | $260,000 | $198 | 50 |
| 206 Scott | 0.58mi | 3/2.0 | 1,273 (+6%) | 11mo | $239,900 | $188 | 49 |
| 209 Ivy Ln | 0.51mi | 4/2.0 (+1) | 1,056 (-12%) | 2mo | $189,000 | $179 | 45 |
| 414 E Langley Blvd | 0.68mi | 2/2.0 (-1) | 1,306 (+9%) | 12mo | $180,000 | $138 | 34 |
| 530 W Byrd Blvd | 0.71mi | 3/2.0 | 1,354 (+13%) | 12mo | $264,500 | $195 | 31 |
Match score weights: distance 35% · size 25% · config 20% · recency 20%. Top-matched comps best support the ARV.
Projected returns pro-forma
-3.0% appreciation · 0.58% rent growth · sell at horizon
- IRR
- -7.3%
- Equity multiple
- 0.74×
- Total profit
- $-8,847
- Equity at exit
- $17,892
- IRR
- -1.2%
- Equity multiple
- 0.93×
- Total profit
- $-2,490
- Equity at exit
- $10,375
Cash invested: $33,600 (down + closing). Projections, not guarantees.
Landlord ↔ Tenant lean methodology
- Overall (STATE)
- 87 Strongly Landlord-Friendly
- State Texas
- 87 Strongly Landlord-Friendly · R+5
- County
- — inherits STATE
- City
- — inherits STATE
ZIP-level market 78148
- Home prices YoY
- -11.5%
- Rents YoY
- 0.6%
- Active inventory
- 128
- Price-to-rent
- 7.3×
Monthly cashflow live
- Estimated rent
- $1,373 high interval (Pro) →
- Mortgage (P&I)
- −$629
- Tax from tax record
- −$188 /mo · $2,257/yr
- Insurance
- −$50
- HOA
- −$0
- Vacancy / Maint / Mgmt
- −$288
- Net cashflow
- $217
Break-even live
UW: 25.0% down · 7.5% · 30yr · 1.5% tax · 5.0% vac · 8.0% maint · 8.0% mgmt
Financing live
Cash to close
- Down payment
- $30,000
- Closing costs
- $3,600
- Reserves months
- —
- Total cash needed
- —
Loan-product check · same deal, 3 products live
Conventional
25% down · 7.5% · 30yr
- Down + closing
- —
- Monthly P&I
- —
- Monthly cashflow
- —
- DSCR
- —
- Eligible?
- —
Personal DTI + credit; lowest rate.
DSCR
20% down · 8.5% · 30yr
- Down + closing
- —
- Monthly P&I
- —
- Monthly cashflow
- —
- DSCR
- —
- Eligible?
- —
No personal income docs; deal must DSCR.
Hard money
10% down · 12.0% · 12mo
- Down + closing
- —
- Monthly P&I
- —
- Monthly cashflow
- —
- DSCR
- —
- Eligible?
- —
Short-term bridge; refi at stabilization.
Rent comps 40 comps
| Address | Beds | Baths | Sqft | Rent | $/sqft | DOM | Units | Dist |
|---|---|---|---|---|---|---|---|---|
| 317 North Blvd Universal City, TX | 3.0 | 2.0 | 1492 | $2,095 | $1.40 | 1d | 1 | 0.28mi |
| 101 Deerglen Ave Universal City, TX | 3.0 | 2.0 | 1470 | $1,600 | $1.09 | 24d | 1 | 0.35mi |
| 149 Village Grn Universal City, TX | 2.0 | 1.0 | 765 | $1,120 | $1.46 | 10d | 10 | 0.48mi |
| 221 Scott Ave Universal City, TX | 3.0 | 2.0 | 1135 | $1,500 | $1.32 | 4d | 1 | 0.61mi |
| 2 W Byrd Blvd Universal City, TX | 2.0 | 1.0 | 775 | $995 | $1.28 | 24d | 1 | 0.62mi |
| 330 Kitty Hawk Rd Universal City, TX | 3.0 | 1.0–2.0 | 826 | $1,335 | $1.62 | 2d | 40 | 0.64mi |
| 605 W Byrd Blvd Unit 2 Universal City, TX | 2.0 | 1.0 | 775 | $995 | $1.28 | 24d | 1 | 0.70mi |
| 607 W Byrd Blvd Unit 605-2 Universal City, TX | 2.0 | 1.0 | 775 | $995 | $1.28 | 24d | 1 | 0.70mi |
| 1950 Universal City Blvd Universal City, TX | 1.0–2.0 | 1.0–2.5 | 835 | $1,293 | $1.55 | 12d | 20 | 0.76mi |
| 1950 Universal City Blvd Universal City, TX | 1.0–2.0 | 1.0–2.5 | 898 | $1,364 | $1.52 | 2d | 19 | 0.76mi |
| 317 E Lindbergh Blvd Universal City, TX | 3.0 | 2.0 | 1379 | $2,100 | $1.52 | 1d | 1 | 0.77mi |
| 206 Balboa Dr Universal City, TX | 3.0 | 2.0 | 1161 | $1,295 | $1.12 | 43d | 1 | 0.86mi |
| 501 Sunrise Canyon Dr Unit 710 Universal City, TX | 2.0 | 2.0 | 882 | $1,186 | $1.34 | 22d | 1 | 0.88mi |
| 501 Sunrise Canyon Dr Universal City, TX | 1.0–3.0 | 1.0–2.0 | 942 | $1,675 | $1.78 | 2d | 18 | 0.88mi |
| 2125 Universal City Blvd Universal City, TX | 1.0–2.0 | 1.0–2.0 | 716 | $1,100 | $1.54 | 2d | 8 | 0.92mi |
| 2280 Pat Booker Rd Universal City, TX | 3.0 | 1.0–2.0 | 964 | $2,235 | $2.32 | 1d | 113 | 1.01mi |
| 2129 Pat Booker Rd Unit 11 Universal City, TX | 3.0 | 1.0 | 1072 | $1,350 | $1.26 | 43d | 1 | 1.05mi |
| 2205 Pat Booker Rd Apt 30 Universal City, TX | 2.0 | 1.0 | 870 | $845 | $0.97 | 24d | 1 | 1.08mi |
| 2205 Pat Booker Rd Universal City, TX | 1.0–2.0 | 1.0 | 755 | $845 | $1.12 | 43d | 3 | 1.09mi |
| 203 Brooks Ave Schertz, TX | 2.0 | 1.0 | 900 | $1,290 | $1.43 | 11d | 1 | 1.10mi |
| 381 Meadow View Dr Schertz, TX | 2.0–3.0 | 1.0–2.0 | 1060 | $1,479 | $1.40 | 10d | 1 | 1.15mi |
| 538 Dukeway Dr Unit C Universal City, TX | 2.0 | 2.0 | 960 | $930 | $0.97 | 17d | 1 | 1.16mi |
| 538 Dukeway Dr Unit C Universal City, TX | 2.0 | 2.0 | 960 | $930 | $0.97 | 20d | 1 | 1.16mi |
| 530 Dukeway Dr Unit 3 Universal City, TX | 2.0 | 2.0 | 985 | $999 | $1.01 | 43d | 1 | 1.17mi |
| 518 Dukeway Dr Apt 1 Universal City, TX | 2.0 | 2.0 | 810 | $1,050 | $1.30 | 15d | 1 | 1.19mi |
| 400 Mitchell Ave Schertz, TX | 3.0 | 2.0 | 1104 | $1,450 | $1.31 | 17d | 1 | 1.25mi |
| 622 Meadow Arbor Ln Unit 1 Universal City, TX | 3.0 | 2.5 | 1300 | $1,499 | $1.15 | 24d | 1 | 1.25mi |
| 10822 Mathom Lndg Unit 3-10822 Universal City, TX | 3.0 | 2.5 | 1421 | $1,075 | $0.76 | 43d | 1 | 1.27mi |
| 10818 Mathom Lndg Unit 3 Universal City, TX | 3.0 | 2.5 | 1421 | $1,045 | $0.74 | 4d | 1 | 1.28mi |
| 10806 Mathom Lndg Unit 2 Universal City, TX | 3.0 | 2.5 | 1400 | $1,250 | $0.89 | 43d | 1 | 1.29mi |
| 620 Fern Meadow Dr Universal City, TX | 2.0 | 1.0 | 998 | $1,195 | $1.20 | 43d | 1 | 1.30mi |
| 10815 Mathom Lndg Unit 3 Universal City, TX | 3.0 | 2.0 | 1421 | $1,100 | $0.77 | 43d | 1 | 1.31mi |
| 10807 Mathom Lndg Unit 3 Universal City, TX | 3.0 | 2.5 | 1420 | $1,095 | $0.77 | 4d | 1 | 1.32mi |
| 11801 E Loop 1604 N Universal City, TX | 1.0–3.0 | 1.0–2.0 | 868 | $1,655 | $1.91 | 2d | 13 | 1.33mi |
| 10723 Mathom Lndg Unit 2 Universal City, TX | 3.0 | 2.5 | 1425 | $1,500 | $1.05 | 43d | 1 | 1.34mi |
| 10719 Mathom Lndg Unit 2 Universal City, TX | 3.0 | 2.5 | 1421 | $1,250 | $0.88 | 43d | 1 | 1.34mi |
| 10711 Mathom Lndg Unit 4 Universal City, TX | 3.0 | 2.5 | 1050 | $900 | $0.86 | 24d | 1 | 1.35mi |
| 10618 Mathom Lndg Apt 4 Universal City, TX | 3.0 | 2.5 | 1420 | $1,100 | $0.77 | 17d | 1 | 1.36mi |
| 10610 Mathom Lndg Unit 3 Universal City, TX | 3.0 | 2.5 | 1420 | $1,100 | $0.77 | 20d | 1 | 1.37mi |
| 10619 Mathom Lndg Unit 2 Universal City, TX | 3.0 | 2.5 | 1421 | $1,300 | $0.91 | 43d | 1 | 1.38mi |
Listing history 5 events
-
2026-06-02statusdays on market $120,000 Pending 12 DOM
-
2026-06-01statusdays on market $120,000 Active 11 DOM
-
2026-05-31days on market $120,000 New 10 DOM
-
2026-05-21$120,000 New
-
1993-06-01soldstatus
ⓘ Source: listings_history table (triggers on properties + properties_extension) + one-shot
backfill from property_details.listing_events for pre-trigger history.
Tax reassessment forecast TX · Resets to sale price
- Current annual tax
- $2,257 · $188/mo
- Projected year-2 tax
- $2,257 · $188/mo
- Expected delta
- $0/yr ($0/mo · 0.0%)
ⓘ Screening estimate from a state-policy table — verify with the county assessor before closing.
Climate risk First Street
- Flood 1/10 Low FEMA zone X (unshaded) · 0% chance over 30 yrs
- Wildfire 4/10 Moderate
- Heat 8/10 Severe 7 d/yr ≥108°F today · 22 d/yr by 30 yrs out
- Wind 8/10 Severe 80% chance of damaging wind over 30 yrs
- Air quality 2/10 Low 0 unhealthy d/yr today · 1 by 30 yrs out
Nearby sold comps map
Loading sold comps map…
Walkable amenities ~0.75 mi
Loading nearby amenities…
Taxation est. · year 1
- Rental income
- $16,471
- − Mortgage interest
- −$6,722
- − Property taxes
- −$2,257
- − Insurance
- −$600
- − Repairs & maintenance
- −$1,318
- − Management
- −$1,318
- − Depreciation
- −$3,491
- Taxable income
- $766
- Est. tax owed @ 24.0%
- −$184
- After-tax cash flow
- $2,420/yr
For passive investors: Depreciation is non-cash, so a rental often shows a tax loss while cash-flowing — sheltering income. Rental losses are passive: they offset passive income freely, and up to $25,000/yr can offset ordinary (W-2) income if you actively participate and your MAGI is under $100k (phasing out to $0 by $150k); unused losses carry forward. On sale, claimed depreciation is recaptured at up to 25%, and gains may owe capital-gains tax (a 1031 exchange can defer both). Figures are a year-1 estimate at your 24.0% rate — not tax advice; consult a CPA.
Schools (NCES district)
- District
- Schertz-Cibolo-U City ISD
- NCES district ID
- 4839480
- Math proficiency
- 49% ▼ -12.00%
- Reading proficiency
- 48% ▼ -4.00%
- Median HH income
- $75,790
- Composite
- 44.02/100
- National rank
- #2886
- State rank
- #152 of 826 in TX
Livability — Universal City
- Score
- 74/100
- State rank
- #174
- US rank
- #4608
Category grades
Schools grade is shown separately in the Schools card above.
Census & demographics
- Census place
- Universal City, TX
- County
- Bexar County · 1,990,555 people
- City population
- 22,187
- Metro
- San Antonio-New Braunfels, TX
- Population (ZIP)
- 22,187
- Household income
- $74,783
- Rent vs Own
- Severe rent burden
- 723.0
Population outlook (Bexar County) Hauer SSP2
- Today (2025)
- 2,336,851 people
- By 2030
- 2,560,728 · +9.6%
- By 2040
- 3,020,569 · +29.3%
- By 2050
- 3,493,522 · +49.5%
- By 2075
- 4,668,459 · +99.8%
- By 2100
- 5,533,242 · +136.8%
Race, ethnicity, and origin ACS 2023
- Neighborhood character
- Diverse neighborhood (Simpson 0.66)
- Race & ethnicity
- White 42% Hispanic / Latino 38% Two or more races 19% Black 11% Asian 4%
- Hispanic origin (detail)
- Mexican 31% Puerto Rican 3%
- Common ancestry
- Lithuanian 2% Slovak 2% Portuguese 1%
- Foreign-born
- 8% · Canada, South Korea, China
- Languages at home
- 79% English-only · Spanish 17% German/W. Germanic 2% Tagalog/Filipino 1%
Political lean MEDSL · Bexar
- 2024 margin
- Lean D (+9.8) · D 54.3% · R 44.6% · Other 1.1%
- 2008→2024 swing
- +4.2pp toward D · 2008: 5.6pp · 2024: 9.8pp
- All cycles
- 2024: D+9.8 2020: D+18.2 2016: D+13.5 2012: D+4.6 2008: D+5.6
Not yet ingested
- Civics
- —
Market trends
- HPI YoY
- ▼ -32.94%
- Current HPI
- 252.7143
- Rent YoY
- ▲ 0.58%
- Metro
- San Antonio-New Braunfels, TX
- State GDP YoY
- ▲ 3.95%
- F500 in state
- 110
Industry mix (Fortune 500 HQ in TX)
| Industry | F500 HQs | Revenue |
|---|---|---|
| Energy | 16 | $1,198B |
|
||
| Technology | 5 | $198B |
|
||
| Engineering / Construction | 4 | $72B |
|
||
| Energy Services | 3 | $60B |
|
||
| Utilities | 3 | $41B |
|
||
| Healthcare | 2 | $330B |
|
||
Price history
2 events — show timeline
- 2026-05-21 Listed $120,000 LERA
- 1993-06-01 Sold (Public Records) — Public Records
Property tax history
+6.6%/yrLatest (2025): $2,257 · -42.9% YoY. Source: county tax records.
Cash-flow waterfall
monthlySold comps — $/sqft
last 12 mo · ≤1 miLoading sold comps…