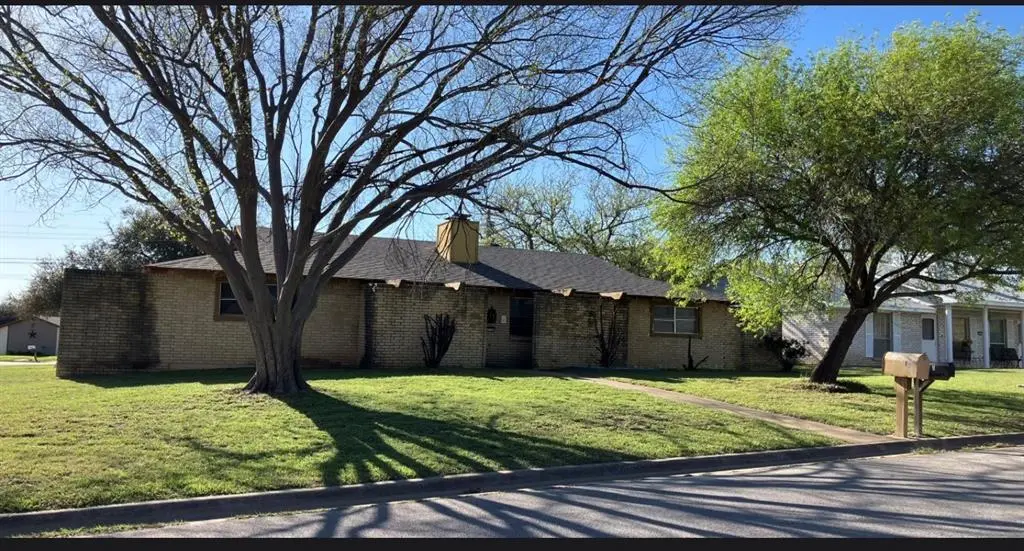
414 Cheyenne Dr
Temple, TX 76504
$239,000C+
None bd · 2.0 ba ·
2,052 sqft ·
Built 1973
· MultiFamily
· Active
· 77 DOM
Cashflow @ list (25.0% down · 7.5%)
Estimated rent
$2,689/mo
Mortgage (P&I)
−$1,253
Tax + insurance
−$418
HOA
−$0
Vac / Maint / Mgmt
−$565
Net cashflow
$453/mo
Annual
$5,436/yr
Cap rate
8.57%
Cash-on-cash
8.12%
DSCR
1.36
1% rule
1.13%
Cash to close
$66,920
Investor read
- This is a 2 × 3-bed/1.5-bath units multifamily listed at $239k.
- At list price, monthly cash flow is $453 ($5k/yr) — positive. Per door: $227/mo.
- The deal already cash-flows at list — no discount required.
- Meets the 1% rule at list price ($3k rent vs $239k).
- It's been on market 77 days — a 6% lower offer ($225k) is reasonable based on typical stale-listing flexibility.
- Recommended offer: $225k (6.0% below list) — sets the bar for market timing.
- Local home prices are declining (-3.0%/yr); year-one equity from $2k of loan paydown is wiped out by about $7k of value loss. Plan a longer hold.
- Location reads 75/100 on livability (#122 in TX, #3,814 nationally) — a middle-class / working-renter tenant base. Strengths: cost of living A+, housing A+, health & safety A+; Watch: schools C-, commute C-, crime D+.
- Temple ISD (urban): math 32% / reading 31% proficiency, ranked #590 of 826 in TX (top 71%) — families likely to look elsewhere, expect single-tenant / working-renter base with shorter leases; 66% free/reduced lunch — lower-income household profile, screen leases tightly.
- Market conditions: Rents flat; 276 active listings in the ZIP; 6 comparable units currently listed for rent nearby; rentals at typical pace (median 24d on market — plan ~3-4 weeks tenant-placement turnaround); 3,222 units permitted in Bell County in 2024 (246 in 5+ unit buildings).
- Bell County population projected at +21% by 2050 — long-run rental-demand tailwind backs the buy-and-hold thesis.
- Climate carrying-cost: major wind risk, 70% chance of damaging wind over 30y; extreme-heat days projected 7→24/yr by 2055 (HVAC capex compounding) — expect insurance premiums to compound above CPI over the hold.
- Cap rate 8.6% vs local median 3.6% in Temple — top-decile yield for the area; either an underpriced asset or a hidden risk that comps aren't pricing in. Stress-test before assuming the spread holds.
- At $2,689/mo this rent would consume 61% of the median local household income ($53k/yr) (locally 1489% of renters already pay >50% of income on rent) — very limited rent-growth headroom before tenants either downsize or default.
Questions for listing agent
- It's been on market 77 days. Have you received any prior offers? Is the seller open to a 6% concession, seller financing, or rate buy-down credit?
- Can we see the unit-by-unit rent roll, current vacancy, and any below-market leases? What's the average tenancy length?
- What capital expenditures (roof, boiler, parking lot, exteriors) have been made in the last 5 years, and what's planned in the next 2?
- Built in 1973 — when were the roof, HVAC, electrical panel, plumbing, and water heater last replaced?
- Why hasn't it sold? Are there any deal-killer items the seller is aware of (foundation, flood, title, zoning, code violations)?
- Is there a deadline driving the sale (1031 exchange, divorce, estate, relocation)? That informs how much negotiation room exists.
- Crime grade is D in this area — have there been break-ins, vandalism, or insurance claims at this property in the last 3 years? What carrier currently insures it and at what premium?
- What's the average days-on-market for RENTAL listings here right now (not sales)? A rising rental-DOM trend means longer vacancies and softer asking-rent achievability than the comps imply.
CashFlowRE · CFR-PVDJWHA4TPYPJP
· Data 2 weeks ago
cashflowre.app · 2026-05-29