 Duplex
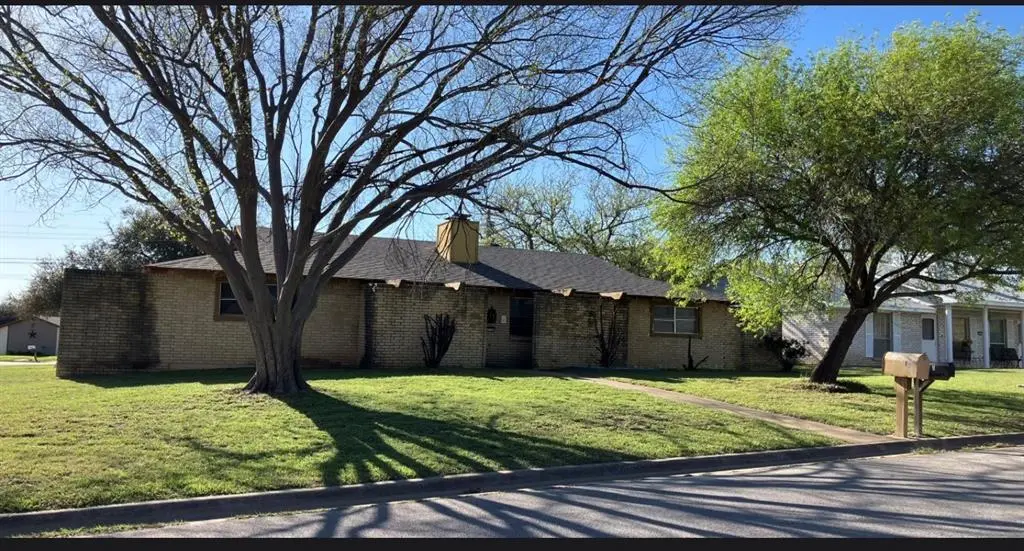
414 Cheyenne Dr · Temple, TX
Flood risk 1/10 · Minimal
- FEMA flood zone
- X (unshaded)
- Chance of flooding over 30 yrs
- 0.0%
- Est. flood insurance / yr
- $507 – $1,088
Fire risk 4/10 · Minor
- Est. fire insurance / yr
- $1,222 – $2,270
Heat risk 8/10 · Major
- Hot days now (above 108°F)
- 7 days/yr
- Hot days in 30 yrs
- 24 days/yr
Wind risk 6/10 · Moderate
- Chance of severe wind over 30 yrs
- 70.0%
Air-quality risk 2/10 · Minimal
- Unhealthy air days now
- 0 days/yr
- Unhealthy air days in 30 yrs
- 1 days/yr
Risk factors via First Street. Map © Google.
Why this score? — see what drove the C+ grade
The composite is a weighted blend of 9 inputs, each scored 0–100. Each bar is that input's sub-score; the figure is the points it added to the 100-point composite (weight × sub-score).
- Cash flow +23.7/30.0
- ARV discount +14.6/15.0
- DSCR +7.6/10.0
- 1% rule +6.3/10.0
- Livability +3.8/5.0
- Schools +2.7/10.0
- Rent growth +2.6/5.0
- Condition / age +2.5/5.0
- Appreciation +0.0/10.0
$239,000
🖨 Deal sheet 📄 Offer letter ✓ Due diligence
Multi-family units
County records classify this as Multi-Family (2-4 Unit). Listing-text estimate: 2 units. confirmed
Listing remarks MLS
This beautifully renovated 4-bedroom, 3-bath duplex offers a prime investment opportunity just one mile from the heart of downtown Temple, TX. Over the past two years, the property has been fully updated, refreshed interiors, and well-maintained systems making it truly turnkey for its next owner. Each unit is thoughtfully designed to provide comfortable living spaces, appealing to long-term tenants and future renters alike. The property is currently occupied by two reliable long-term tenants, providing immediate rental income. One lease expires at the end of April, and the other at the end of July, offering flexibility for potential rent adjustments or owner occupancy. Currently, rents are set at $850 per unit, presenting a strong value-add opportunity, as market rents for similar unit in the area can reach up to $1,050. With its ideal location near downtown Temple, recent upgrades, and upside potential in rental income, this duplex is a smart addition to any investment portfolio.
Key facts
- Fully updated
- Modern finishes
- Refreshed interiors
Tags
Neighborhood map
What this means for you Summary
Snapshot
- This is a 2 × 3-bed/1.5-bath units multifamily listed at $239k.
Deal economics
- At list price, monthly cash flow is $453 ($5k/yr) — positive. Per door: $227/mo.
- The deal already cash-flows at list — no discount required.
- Meets the 1% rule at list price ($3k rent vs $239k).
- Recommended offer: $225k (6.0% below list) — sets the bar for market timing.
- Cap rate 8.6% vs local median 3.6% in Temple — top-decile yield for the area; either an underpriced asset or a hidden risk that comps aren't pricing in. Stress-test before assuming the spread holds.
Location & tenants
- Location reads 75/100 on livability (#122 in TX, #3,814 nationally) — a middle-class / working-renter tenant base. Strengths: cost of living A+, housing A+, health & safety A+; Watch: schools C-, commute C-, crime D+.
- Temple ISD (urban): math 32% / reading 31% proficiency, ranked #590 of 826 in TX (top 71%) — families likely to look elsewhere, expect single-tenant / working-renter base with shorter leases; 66% free/reduced lunch — lower-income household profile, screen leases tightly.
- Market conditions: Rents flat; 276 active listings in the ZIP; 6 comparable units currently listed for rent nearby; rentals at typical pace (median 24d on market — plan ~3-4 weeks tenant-placement turnaround); 3,222 units permitted in Bell County in 2024 (246 in 5+ unit buildings).
- At $2,689/mo this rent would consume 61% of the median local household income ($53k/yr) (locally 1489% of renters already pay >50% of income on rent) — very limited rent-growth headroom before tenants either downsize or default.
Forward outlook
- Local home prices are declining (-3.0%/yr); year-one equity from $2k of loan paydown is wiped out by about $7k of value loss. Plan a longer hold.
- Bell County population projected at +21% by 2050 — long-run rental-demand tailwind backs the buy-and-hold thesis.
Negotiation context
- It's been on market 77 days — a 6% lower offer ($225k) is reasonable based on typical stale-listing flexibility.
Risks & watch-outs
- Climate carrying-cost: major wind risk, 70% chance of damaging wind over 30y; extreme-heat days projected 7→24/yr by 2055 (HVAC capex compounding) — expect insurance premiums to compound above CPI over the hold.
Questions for the listing agent
- It's been on market 77 days. Have you received any prior offers? Is the seller open to a 6% concession, seller financing, or rate buy-down credit?
- Can we see the unit-by-unit rent roll, current vacancy, and any below-market leases? What's the average tenancy length?
- What capital expenditures (roof, boiler, parking lot, exteriors) have been made in the last 5 years, and what's planned in the next 2?
- Built in 1973 — when were the roof, HVAC, electrical panel, plumbing, and water heater last replaced?
- Why hasn't it sold? Are there any deal-killer items the seller is aware of (foundation, flood, title, zoning, code violations)?
- Is there a deadline driving the sale (1031 exchange, divorce, estate, relocation)? That informs how much negotiation room exists.
- Crime grade is D in this area — have there been break-ins, vandalism, or insurance claims at this property in the last 3 years? What carrier currently insures it and at what premium?
- What's the average days-on-market for RENTAL listings here right now (not sales)? A rising rental-DOM trend means longer vacancies and softer asking-rent achievability than the comps imply.
- What's the recent tenant-quality profile in this submarket — average credit score on applications, eviction rate, late-payment / NSF rate, and stable-employment percentage? A property-management company in the area should have these aggregated.
- How much new apartment / multifamily construction is in the pipeline within 1–3 miles? Heavy new supply (>2% of stock underway) typically softens rents 12–24 months out; light construction supports rent growth.
Investment metrics
- 1% rule
- 1.13% ✓
- Cap rate
- 8.57%
- Cash-on-cash
- 8.12%
- DSCR
- 1.36
- GRM
- 7.4
CMA / ARV
- ARV (median comp)
- $283,965
- List price
- $239,000
- Delta
- -15.83%
- Verdict
- UNDERPRICED
- Comps
- 11 within 2.0 mi
Show comp detail 1 sale within ~0.75 mi
| Address | Dist | Beds/Ba | Sqft | Sold | Price | $/sf | Match |
|---|---|---|---|---|---|---|---|
| 610 Cheyenne Dr | 0.13mi | 4/3.0 | 2,320 (+13%) | 2mo | $225,000 | $97 | 67 |
Match score weights: distance 35% · size 25% · config 20% · recency 20%. Top-matched comps best support the ARV.
Projected returns pro-forma
-3.0% appreciation · 0.33% rent growth · sell at horizon
- IRR
- -7.0%
- Equity multiple
- 0.75×
- Total profit
- $-16,858
- Equity at exit
- $35,636
- IRR
- -1.2%
- Equity multiple
- 0.93×
- Total profit
- $-4,683
- Equity at exit
- $20,664
Cash invested: $66,920 (down + closing). Projections, not guarantees.
Landlord ↔ Tenant lean methodology
- Overall (STATE)
- 87 Strongly Landlord-Friendly
- State Texas
- 87 Strongly Landlord-Friendly · R+5
- County
- — inherits STATE
- City
- — inherits STATE
ZIP-level market 76504
- Rents YoY
- 0.3%
- Active inventory
- 276
- Price-to-rent
- 14.8×
Monthly cashflow live
- Estimated rent
- $2,689 high interval (Pro) →
- Mortgage (P&I)
- −$1,253
- Tax from tax record
- −$318 /mo · $3,820/yr
- Insurance
- −$100
- HOA
- −$0
- Vacancy / Maint / Mgmt
- −$565
- Net cashflow
- $453
Break-even live
2-unit breakdown (identical units grouped — click to expand)
| Units | Beds | Baths | Est. rent |
|---|---|---|---|
| 2× units | 3 | 1.5 | $2,688 |
| #1 | 3 | 1.5 | $1,344 |
| #2 | 3 | 1.5 | $1,344 |
| Total (2 units) | $2,689 | ||
UW: 25.0% down · 7.5% · 30yr · 1.5% tax · 5.0% vac · 8.0% maint · 8.0% mgmt
Financing live
Cash to close
- Down payment
- $59,750
- Closing costs
- $7,170
- Reserves months
- —
- Total cash needed
- —
Loan-product check · same deal, 3 products live
Conventional
25% down · 7.5% · 30yr
- Down + closing
- —
- Monthly P&I
- —
- Monthly cashflow
- —
- DSCR
- —
- Eligible?
- —
Personal DTI + credit; lowest rate.
DSCR
20% down · 8.5% · 30yr
- Down + closing
- —
- Monthly P&I
- —
- Monthly cashflow
- —
- DSCR
- —
- Eligible?
- —
No personal income docs; deal must DSCR.
Hard money
10% down · 12.0% · 12mo
- Down + closing
- —
- Monthly P&I
- —
- Monthly cashflow
- —
- DSCR
- —
- Eligible?
- —
Short-term bridge; refi at stabilization.
Rent comps 6 comps
| Address | Beds | Baths | Sqft | Rent | $/sqft | DOM | Units | Dist |
|---|---|---|---|---|---|---|---|---|
| 1506 Live Oak Dr Temple, TX | 3.0 | 2.0 | 1571 | $1,475 | $0.94 | 43d | 1 | 0.85mi |
| 1519 S 43rd St Temple, TX | 3.0 | 2.0 | 1400 | $1,595 | $1.14 | 13d | 1 | 1.08mi |
| 2510 Bunker Hill Dr Temple, TX | 3.0 | 2.0 | 1647 | $1,775 | $1.08 | 23d | 1 | 1.08mi |
| 720 Frank Weise Blvd Unit A Temple, TX | 3.0 | 2.0 | 1400 | $1,600 | $1.14 | 13d | 1 | 1.14mi |
| 2106 S 47th St Temple, TX | 3.0 | 2.0 | 1498 | $1,645 | $1.10 | 13d | 1 | 1.34mi |
| 1335 Brookfield St Temple, TX | 3.0 | 2.0 | 1501 | $1,695 | $1.13 | 43d | 1 | 1.39mi |
Listing history 11 events
-
2026-06-03days on market $239,000 Active 77 DOM
-
2026-06-02days on market $239,000 Active 76 DOM
-
2026-06-01days on market $239,000 Active 75 DOM
-
2026-05-31days on market $239,000 Active 74 DOM
-
2026-05-30days on market $239,000 Active 73 DOM
-
2026-03-18$239,000 Active 1001-char remark
Show marketing remark (1001 chars)
This beautifully renovated 4-bedroom, 3-bath duplex offers a prime investment opportunity just one mile from the heart of downtown Temple, TX. Over the past two years, the property has been fully updated, refreshed interiors, and well-maintained systems making it truly turnkey for its next owner. Each unit is thoughtfully designed to provide comfortable living spaces, appealing to long-term tenants and future renters alike. The property is currently occupied by two reliable long-term tenants, providing immediate rental income. One lease expires at the end of April, and the other at the end of July, offering flexibility for potential rent adjustments or owner occupancy. Currently, rents are set at $850 per unit, presenting a strong value-add opportunity, as market rents for similar unit in the area can reach up to $1,050. With its ideal location near downtown Temple, recent upgrades, and upside potential in rental income, this duplex is a smart addition to any investment portfolio.
-
2025-10-08soldstatus
-
2017-05-30soldstatus
-
2008-02-25soldstatus
-
2004-02-02soldstatus
-
1973-02-01soldstatus
ⓘ Source: listings_history table (triggers on properties + properties_extension) + one-shot
backfill from property_details.listing_events for pre-trigger history.
Tax reassessment forecast TX · Resets to sale price
- Current annual tax
- $3,820 · $318/mo
- Projected year-2 tax
- $4,374 · $364/mo
- Expected delta
- +$553/yr (+$46/mo · 14.5%)
ⓘ Screening estimate from a state-policy table — verify with the county assessor before closing.
Climate risk First Street
- Flood 1/10 Low FEMA zone X (unshaded) · 0% chance over 30 yrs
- Wildfire 4/10 Moderate
- Heat 8/10 Severe 7 d/yr ≥108°F today · 24 d/yr by 30 yrs out
- Wind 6/10 Major 70% chance of damaging wind over 30 yrs
- Air quality 2/10 Low 0 unhealthy d/yr today · 1 by 30 yrs out
Nearby sold comps map
Loading sold comps map…
Walkable amenities ~0.75 mi
Loading nearby amenities…
Taxation est. · year 1
- Rental income
- $32,268
- − Mortgage interest
- −$13,388
- − Property taxes
- −$3,820
- − Insurance
- −$1,195
- − Repairs & maintenance
- −$2,581
- − Management
- −$2,581
- − Depreciation
- −$6,953
- Taxable income
- $1,749
- Est. tax owed @ 24.0%
- −$420
- After-tax cash flow
- $5,016/yr
For passive investors: Depreciation is non-cash, so a rental often shows a tax loss while cash-flowing — sheltering income. Rental losses are passive: they offset passive income freely, and up to $25,000/yr can offset ordinary (W-2) income if you actively participate and your MAGI is under $100k (phasing out to $0 by $150k); unused losses carry forward. On sale, claimed depreciation is recaptured at up to 25%, and gains may owe capital-gains tax (a 1031 exchange can defer both). Figures are a year-1 estimate at your 24.0% rate — not tax advice; consult a CPA.
Schools (NCES district)
- District
- Temple ISD
- NCES district ID
- 4842330
- Math proficiency
- 32% ▼ -8.00%
- Reading proficiency
- 31% ▼ -4.00%
- Median HH income
- $43,120
- Composite
- 26.8/100
- National rank
- #7123
- State rank
- #590 of 826 in TX
Livability — Temple
- Score
- 75/100
- State rank
- #122
- US rank
- #3814
Category grades
Schools grade is shown separately in the Schools card above.
Census & demographics
- Census place
- Temple, TX
- County
- Bell County · 345,090 people
- City population
- 96,587
- Metro
- Killeen-Temple, TX
- Population (ZIP)
- 26,166
- Household income
- $52,803
- Rent vs Own
- Severe rent burden
- 1489.0
Population outlook (Bell County) Hauer SSP2
- Today (2025)
- 371,114 people
- By 2030
- 389,104 · +4.8%
- By 2040
- 420,592 · +13.3%
- By 2050
- 447,779 · +20.7%
- By 2075
- 499,130 · +34.5%
- By 2100
- 505,680 · +36.3%
Race, ethnicity, and origin ACS 2023
- Neighborhood character
- Diverse neighborhood (Simpson 0.65)
- Race & ethnicity
- White 49% Hispanic / Latino 29% Black 15% Two or more races 14% Asian 1%
- Hispanic origin (detail)
- Mexican 24% Puerto Rican 2%
- Common ancestry
- Italian 2% Romanian 2% Lithuanian 1%
- Foreign-born
- 8% · Canada
- Languages at home
- 81% English-only · Spanish 17% Other Indo-European 1%
Political lean MEDSL · Bell
- 2024 margin
- R (+16.2) · D 41.3% · R 57.6% · Other 1.1%
- 2008→2024 swing
- -6.5pp toward R · 2008: -9.8pp · 2024: -16.2pp
- All cycles
- 2024: R+16.2 2020: R+8.5 2016: R+15.1 2012: R+16.4 2008: R+9.8
Not yet ingested
- Civics
- —
Market trends
- HPI YoY
- ▼ -159.28%
- Current HPI
- 186.1148
- Rent YoY
- ▲ 0.33%
- Metro
- Killeen-Temple, TX
- State GDP YoY
- ▲ 3.95%
- F500 in state
- 110
Industry mix (Fortune 500 HQ in TX)
| Industry | F500 HQs | Revenue |
|---|---|---|
| Energy | 16 | $1,198B |
|
||
| Technology | 5 | $198B |
|
||
| Engineering / Construction | 4 | $72B |
|
||
| Energy Services | 3 | $60B |
|
||
| Utilities | 3 | $41B |
|
||
| Healthcare | 2 | $330B |
|
||
Price history
6 events — show timeline
- 2026-03-18 Listed $239,000 NTREIS
- 2025-10-08 Sold (Public Records) — Public Records
- 2017-05-30 Sold (Public Records) — Public Records
- 2008-02-25 Sold (Public Records) — Public Records
- 2004-02-02 Sold (Public Records) — Public Records
- 1973-02-01 Sold (Public Records) — Public Records
Property tax history
+4.9%/yrLatest (2025): $3,820 · -11.9% YoY. Source: county tax records.
Cash-flow waterfall
monthlySold comps — $/sqft
last 12 mo · ≤1 miLoading sold comps…