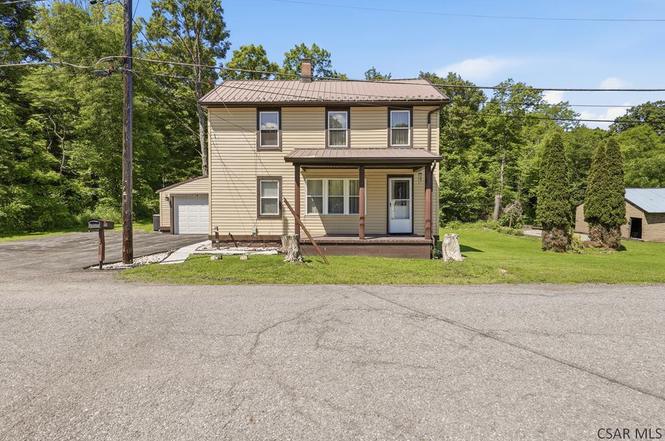
111 Center St
Shade, PA 15563
$111,000B-
3 bd · 1.0 ba ·
1,504 sqft ·
Built 1900
· SingleFamily
· Active
· 6 DOM
Cashflow @ list (25.0% down · 7.5%)
Estimated rent
$1,241/mo
Mortgage (P&I)
−$582
Tax + insurance
−$473
HOA
−$0
Vac / Maint / Mgmt
−$261
Net cashflow
$-74/mo
Annual
$-891/yr
Cap rate
8.88%
Cash-on-cash
9.25%
DSCR
1.41
1% rule
1.12%
Cash to close
$31,080
Investor read
- This is a 3-bed/1.0-bath single-family listed at $111k.
- At list price, monthly cash flow is $-74 ($-891/yr) — negative.
- To cash-flow at today's rent, offer at most $98k (11.8% below list).
- Meets the 1% rule at list price ($1k rent vs $111k).
- Only 6 days on market — expect competitive offers; lowballing is unlikely to land.
- Recommended offer: $98k (11.8% below list) — sets the bar for cash-flow.
- In year one you build about $5k of equity ($767 loan paydown + $4k appreciation (3.9% local appreciation)).
- Location reads: area grade B — affects rentability + tenant quality, not the cash-flow math above.
- Shade-Central City SD (rural): math 45% / reading 55% proficiency, ranked #411 of 658 in PA (top 62%) — acceptable for families but not a draw, mixed tenant base, ~2y average lease.
- Zoned schools: Cairnbrook El Sch (math 32% / reading 47%, grade F, #947 of 1,518 statewide, top 65%, 166 students, 100% FRL); Shade Jshs (math 47% / reading 24%, grade F, #305 of 437 statewide, top 70%, 164 students, 60% FRL) — zoned schools average 80% FRL vs 42% district-wide (38 pts higher); higher-poverty schools than district average — tighter screening recommended.
- Zoned-school proficiency averages 38% at this address vs 50% district-wide (-12 pts) — the specific schools serving this property underperform the Shade-Central City SD average; the district grade overstates school quality for this exact location.
- Watch-outs: flood insurance adds $314/mo; built in 1900 — expect roof / HVAC / electrical / plumbing capex.
- Market conditions: 22 active listings in the ZIP; 78 units permitted in Somerset County in 2024 (0 in 5+ unit buildings).
- Somerset County population projected at -21% by 2050 — secular population decline; favor cash flow + early exit over multi-decade hold.
- 2 sale attempts with the ask held roughly flat each time — persistent listings suggest the price (not the market) is what's stuck; bring a comps-based counter.
- At projected returns (3.9% appreciation + 3.0% rent growth), your $31k cash investment doubles in ~6 years — after that, you're playing with house money.
- By year 7, paydown + projected appreciation supports a ~$32k cash-out refi (75% LTV) — recoverable capital for the next deal without selling this one.
- Climate carrying-cost: in FEMA flood zone A (mandatory federal flood insurance) — expect insurance premiums to compound above CPI over the hold.
Questions for listing agent
- What do current leases actually rent for vs. the listed asking? Can we see a recent rent roll and the last 12 months of T-12 income?
- Built in 1900 — when were the roof, HVAC, electrical panel, plumbing, and water heater last replaced?
- What's the actual annual flood-insurance premium (NFIP or private), and is the property in a SFHA with mandatory coverage?
- Is there a deadline driving the sale (1031 exchange, divorce, estate, relocation)? That informs how much negotiation room exists.
- What's the average days-on-market for RENTAL listings here right now (not sales)? A rising rental-DOM trend means longer vacancies and softer asking-rent achievability than the comps imply.
- What's the recent tenant-quality profile in this submarket — average credit score on applications, eviction rate, late-payment / NSF rate, and stable-employment percentage? A property-management company in the area should have these aggregated.
- How much new for-sale + rental construction is in the pipeline within 1–3 miles? Heavy new supply typically softens prices + rents 12–24 months out; constrained supply supports both.
CashFlowRE · CFR-PVJJ1Z262EQQY5
· Data 19 h ago
cashflowre.app · 2026-05-29