111 Center St · Shade, PA
Flood risk 10/10 · Severe
- FEMA flood zone
- A
- Chance of flooding over 30 yrs
- 0.99%
- Est. flood insurance / yr
- $946 – $6,584
Fire risk 3/10 · Minor
- Est. fire insurance / yr
- $511 – $949
Heat risk 3/10 · Minor
- Hot days now (above 88°F)
- 7 days/yr
- Hot days in 30 yrs
- 18 days/yr
Wind risk 2/10 · Minimal
- Chance of severe wind over 30 yrs
- —
Air-quality risk 2/10 · Minimal
- Unhealthy air days now
- 0 days/yr
- Unhealthy air days in 30 yrs
- 1 days/yr
Risk factors via First Street. Map © Google.
Why this score? — see what drove the B- grade
The composite is a weighted blend of 9 inputs, each scored 0–100. Each bar is that input's sub-score; the figure is the points it added to the 100-point composite (weight × sub-score).
- Cash flow +24.9/30.0
- DSCR +8.1/10.0
- ARV discount +7.5/15.0
- Appreciation +6.9/10.0
- 1% rule +6.2/10.0
- Schools +4.4/10.0
- Rent growth +2.5/5.0
- Livability +2.5/5.0
- Condition / age +2.5/5.0
$111,000
🖨 Deal sheet (PDF) 📄 Offer letter ✓ Due diligence
Listing remarks MLS
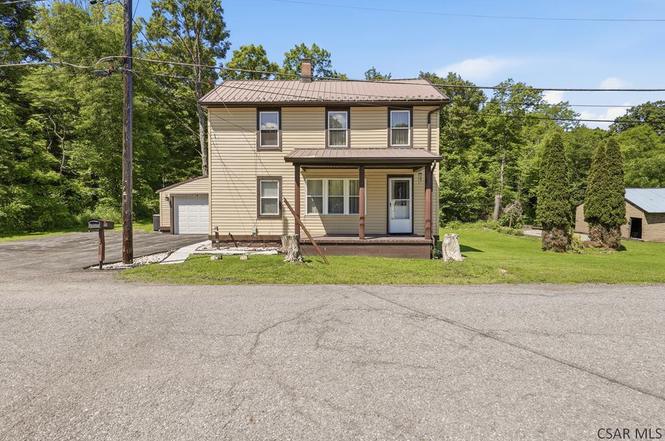
Welcome to your own private sanctuary. If you have been searching for a peaceful retreat, look no further. Imagine starting your mornings on the back deck, sipping your coffee while birdwatching and listening to the gentle, calming sounds of the nearby stream. This tranquil outdoor setting provides the perfect daily escape and a wonderful space to unwind. Situated on a spacious corner lot, this classic older home boasts incredible original character and solid bones. Inside, the welcoming layout features three comfortable bedrooms and 1.5 bathrooms. The home perfectly balances its timeless charm with thoughtful modern conveniences, including all-new windows and updated remote-controlled ceiling fans for year-round comfort. An attached garage is conveniently connected to the main house by a charming breezeway, keeping you protected from the elements year-round. There is also a large shed out back for anything you may need to store. You can also enjoy true peace of mind with significant, low-maintenance exterior investments, including brand-new siding installed just two years ago and premium leaf guard gutters. Don't miss the opportunity to own this beautiful home where historic charm meets natural serenity. Schedule your private showing today and experience the tranquility for yourself.
Key facts
- Charming breezeway
- Attached garage
- Spacious corner lot
Tags
Property features AI
Exterior
- Parking: Attached garage with garage door opener; Total parking for 3 vehicles
- Utilities: Public sewer; Well water
- Home design: 2-story home; Resale property
- Construction: Vinyl siding; Metal roof
- Exterior features: Lot roughly 0.58 acres; Lot dimensions approximately 175 x 140 x 156 x 161
Interior
- Kitchen: Dishwasher; Microwave; Refrigerator; Stove; Some gas appliances
- Flooring: Carpet; Laminate
- Bathrooms: 1 full bathroom; 1 half bathroom
- Heating & cooling: Forced air heating; Oil-fired heating
- Interior features: Multi-pane windows with screens and window treatments; Unfinished walk-out basement; Fireplace (1)
Neighborhood map
What this means for you Summary
Snapshot
- This is a 3-bed/1.0-bath single-family listed at $111k.
Deal economics
- At list price, monthly cash flow is $-74 ($-891/yr) — negative.
- To cash-flow at today's rent, offer at most $98k (11.8% below list).
- Meets the 1% rule at list price ($1k rent vs $111k).
- Recommended offer: $98k (11.8% below list) — sets the bar for cash-flow.
Location & tenants
- Location reads: area grade B — affects rentability + tenant quality, not the cash-flow math above.
- Shade-Central City SD (rural): math 45% / reading 55% proficiency, ranked #411 of 658 in PA (top 62%) — acceptable for families but not a draw, mixed tenant base, ~2y average lease.
- Zoned schools: Cairnbrook El Sch (math 32% / reading 47%, grade F, #947 of 1,518 statewide, top 65%, 166 students, 100% FRL); Shade Jshs (math 47% / reading 24%, grade F, #305 of 437 statewide, top 70%, 164 students, 60% FRL) — zoned schools average 80% FRL vs 42% district-wide (38 pts higher); higher-poverty schools than district average — tighter screening recommended.
- Zoned-school proficiency averages 38% at this address vs 50% district-wide (-12 pts) — the specific schools serving this property underperform the Shade-Central City SD average; the district grade overstates school quality for this exact location.
- Market conditions: 22 active listings in the ZIP; 78 units permitted in Somerset County in 2024 (0 in 5+ unit buildings).
Forward outlook
- In year one you build about $5k of equity ($767 loan paydown + $4k appreciation (3.9% local appreciation)).
- Somerset County population projected at -21% by 2050 — secular population decline; favor cash flow + early exit over multi-decade hold.
- At projected returns (3.9% appreciation + 3.0% rent growth), your $31k cash investment doubles in ~6 years — after that, you're playing with house money.
- By year 7, paydown + projected appreciation supports a ~$32k cash-out refi (75% LTV) — recoverable capital for the next deal without selling this one.
Negotiation context
- Only 6 days on market — expect competitive offers; lowballing is unlikely to land.
- 2 sale attempts with the ask held roughly flat each time — persistent listings suggest the price (not the market) is what's stuck; bring a comps-based counter.
Risks & watch-outs
- Watch-outs: flood insurance adds $314/mo; built in 1900 — expect roof / HVAC / electrical / plumbing capex.
- Climate carrying-cost: in FEMA flood zone A (mandatory federal flood insurance) — expect insurance premiums to compound above CPI over the hold.
Questions for the listing agent
- What do current leases actually rent for vs. the listed asking? Can we see a recent rent roll and the last 12 months of T-12 income?
- Built in 1900 — when were the roof, HVAC, electrical panel, plumbing, and water heater last replaced?
- What's the actual annual flood-insurance premium (NFIP or private), and is the property in a SFHA with mandatory coverage?
- Is there a deadline driving the sale (1031 exchange, divorce, estate, relocation)? That informs how much negotiation room exists.
- What's the average days-on-market for RENTAL listings here right now (not sales)? A rising rental-DOM trend means longer vacancies and softer asking-rent achievability than the comps imply.
- What's the recent tenant-quality profile in this submarket — average credit score on applications, eviction rate, late-payment / NSF rate, and stable-employment percentage? A property-management company in the area should have these aggregated.
- How much new for-sale + rental construction is in the pipeline within 1–3 miles? Heavy new supply typically softens prices + rents 12–24 months out; constrained supply supports both.
Investment metrics
- 1% rule
- 1.12% ✓
- Cap rate
- 8.88%
- Cash-on-cash
- 9.25%
- DSCR
- 1.41
- GRM
- 7.5
CMA / ARV
No comps found within radius.
Projected returns pro-forma
3.89% appreciation · 3.0% rent growth · sell at horizon
- IRR
- 7.5%
- Equity multiple
- 1.46×
- Total profit
- $14,164
- Equity at exit
- $55,576
- IRR
- 9.9%
- Equity multiple
- 2.64×
- Total profit
- $50,996
- Equity at exit
- $90,344
Cash invested: $31,080 (down + closing). Projections, not guarantees.
Landlord ↔ Tenant lean methodology
- Overall (STATE)
- 62 Landlord-Friendly
- State Pennsylvania
- 62 Landlord-Friendly · EVEN
- County
- — inherits STATE
- City
- — inherits STATE
ZIP-level market 15563
- Home prices YoY
- 2.5%
- Active inventory
- 22
- Price-to-rent
- 7.5×
Monthly cashflow live
- Estimated rent
- $1,241 medium interval (Pro) →
- Mortgage (P&I)
- −$582
- Tax from tax record
- −$113 /mo · $1,351/yr
- Insurance
- −$46
- Flood insurance flood zone
- −$314 /mo · $3,765/yr
- HOA
- −$0
- Vacancy / Maint / Mgmt
- −$261
- Net cashflow
- $-74
Break-even live
Sensitivity live
| Price | -10% $-11 | -5% $-43 | +0% $-74 | +5% $-106 | +10% $-137 |
|---|---|---|---|---|---|
| Rent | -10% $-172 | -5% $-123 | +0% $-74 | +5% $-25 | +10% $24 |
| Rate | -1.0pp $-18 | -0.5pp $-46 | base $-74 | +0.5pp $-103 | +1.0pp $-132 |
UW: 25.0% down · 7.5% · 30yr · 1.5% tax · 5.0% vac · 8.0% maint · 8.0% mgmt
Financing live
Cash to close
- Down payment
- $27,750
- Closing costs
- $3,330
- Reserves months
- —
- Total cash needed
- —
Loan-product check · same deal, 3 products live
Conventional
25% down · 7.5% · 30yr
- Down + closing
- —
- Monthly P&I
- —
- Monthly cashflow
- —
- DSCR
- —
- Eligible?
- —
Personal DTI + credit; lowest rate.
DSCR
20% down · 8.5% · 30yr
- Down + closing
- —
- Monthly P&I
- —
- Monthly cashflow
- —
- DSCR
- —
- Eligible?
- —
No personal income docs; deal must DSCR.
Hard money
10% down · 12.0% · 12mo
- Down + closing
- —
- Monthly P&I
- —
- Monthly cashflow
- —
- DSCR
- —
- Eligible?
- —
Short-term bridge; refi at stabilization.
Listing history 6 events
-
2026-06-21days on market $111,000 Active 6 DOM
-
2026-06-21days on market $111,000 Active 5 DOM
-
2026-06-18days on market $111,000 Active 3 DOM
-
2026-06-17days on market $111,000 Active 2 DOM
-
2026-06-16remarks 699-char remark
-
2026-06-16$111,000 Active 1 DOM
ⓘ Source: listings_history table (triggers on properties + properties_extension) + one-shot
backfill from property_details.listing_events for pre-trigger history.
Tax reassessment forecast PA · Partial reset (capped growth)
- Current annual tax
- $1,351 · $113/mo
- Projected year-2 tax
- $1,553 · $129/mo
- Expected delta
- +$201/yr (+$17/mo · 14.9%)
ⓘ Screening estimate from a state-policy table — verify with the county assessor before closing.
Climate risk First Street
- Flood 10/10 Extreme FEMA zone A · 99% chance over 30 yrs
- Wildfire 3/10 Moderate
- Heat 3/10 Moderate 7 d/yr ≥88°F today · 18 d/yr by 30 yrs out
- Wind 2/10 Low
- Air quality 2/10 Low 0 unhealthy d/yr today · 1 by 30 yrs out
Nearby sold comps map
Loading sold comps map…
Walkable amenities ~0.75 mi
Loading nearby amenities…
Taxation est. · year 1
- Rental income
- $14,893
- − Mortgage interest
- −$6,218
- − Property taxes
- −$1,351
- − Insurance
- −$4,320
- − Repairs & maintenance
- −$1,191
- − Management
- −$1,191
- − Depreciation
- −$3,229
- Taxable loss
- −$2,608
- Est. tax savings @ 24.0%
- +$626
- After-tax cash flow
- $-265/yr
For passive investors: Depreciation is non-cash, so a rental often shows a tax loss while cash-flowing — sheltering income. Rental losses are passive: they offset passive income freely, and up to $25,000/yr can offset ordinary (W-2) income if you actively participate and your MAGI is under $100k (phasing out to $0 by $150k); unused losses carry forward. On sale, claimed depreciation is recaptured at up to 25%, and gains may owe capital-gains tax (a 1031 exchange can defer both). Figures are a year-1 estimate at your 24.0% rate — not tax advice; consult a CPA.
Schools (NCES district)
- District
- Shade-Central City SD
- NCES district ID
- 4221180
- Math proficiency
- 45% ▲ 2.00%
- Reading proficiency
- 55% ▼ -2.00%
- Median HH income
- $39,850
- Composite
- 43.81/100
- National rank
- #6340
- State rank
- #411 of 658 in PA
Livability — Shade
No livability data for this city. (Only ~50 U.S. cities are tracked.)
Census & demographics
- Population (ZIP)
- 2,598
Population outlook (Somerset County) Hauer SSP2
- Today (2025)
- 71,318 people
- By 2030
- 68,555 · -3.9%
- By 2040
- 62,447 · -12.4%
- By 2050
- 56,437 · -20.9%
- By 2075
- 44,453 · -37.7%
- By 2100
- 32,408 · -54.6%
Race, ethnicity, and origin ACS 2023
- Neighborhood character
- Predominantly White (96%)
- Race & ethnicity
- White 96% Two or more races 4% Hispanic / Latino 2%
- Common ancestry
- Romanian 11% Iranian 3% Slovak 2%
- Foreign-born
- 2% · Canada
- Languages at home
- 97% English-only · Spanish 2% German/W. Germanic 1%
Political lean MEDSL · Somerset
- 2024 margin
- Solid R (+57.2) · D 21.0% · R 78.3%
- 2008→2024 swing
- -32.2pp toward R · 2008: -25.0pp · 2024: -57.2pp
- All cycles
- 2024: R+57.2 2020: R+56.3 2016: R+55.9 2012: R+42.9 2008: R+25.0
Not yet ingested
- Civics
- —
Market trends
- HPI YoY
- ▲ 3.89%
- Current HPI
- 161.3785
- Rent YoY
- —
- Metro
- —
- State GDP YoY
- ▲ 1.68%
- F500 in state
- 34
Industry mix (Fortune 500 HQ in PA)
| Industry | F500 HQs | Revenue |
|---|---|---|
| Healthcare | 2 | $309B |
|
||
| Insurance | 2 | $27B |
|
||
| Telecommunications / Media | 1 | $124B |
|
||
| Industrial Distribution | 1 | $22B |
|
||
| Financial Services | 1 | $20B |
|
||
| Chemicals / Materials | 1 | $18B |
|
||
Price history
+0.0% since first listed2 events — show timeline
- 2026-06-15 Listed $111,000 CSMLS
- 2026-06-15 Listed $111,000 West Penn MLS
Property tax history
+2.2%/yrLatest (2026): $1,351 · +3.6% YoY. Source: county tax records.
Cash-flow waterfall
monthlySold comps — $/sqft
last 12 mo · ≤1 miLoading sold comps…