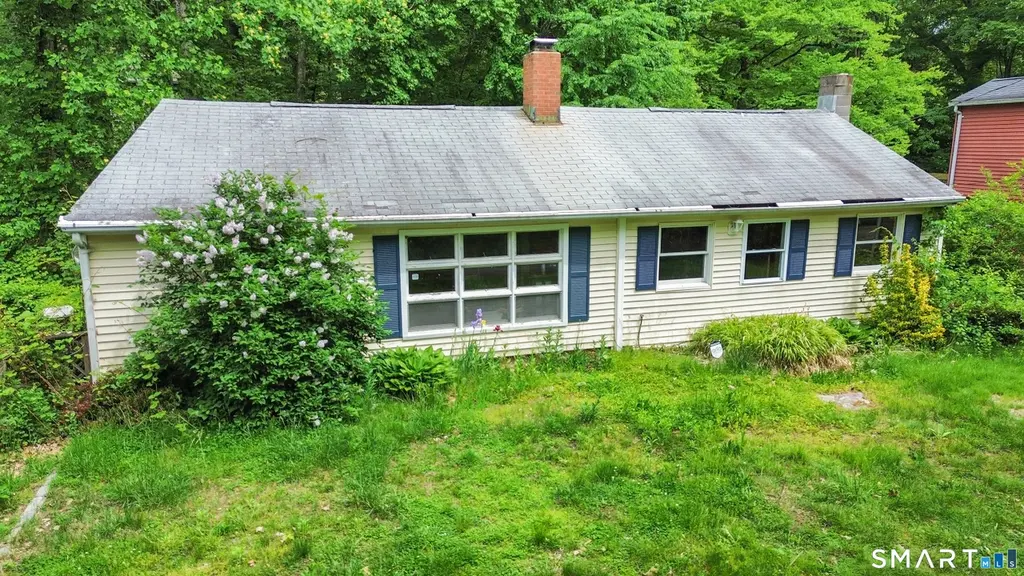
11 Brook Trl
East Hampton, CT 06424
$209,000B-
2 bd · 1.0 ba ·
1,141 sqft ·
Built 1950
· SingleFamily
· Active
· 17 DOM
Cashflow @ list (25.0% down · 7.5%)
Estimated rent
$2,586/mo
Mortgage (P&I)
−$1,096
Tax + insurance
−$480
HOA
−$0
Vac / Maint / Mgmt
−$543
Net cashflow
$468/mo
Annual
$5,613/yr
Cap rate
8.98%
Cash-on-cash
9.59%
DSCR
1.43
1% rule
1.24%
Cash to close
$58,520
Investor read
- This is a 2-bed/1.0-bath single-family listed at $209k.
- At list price, monthly cash flow is $468 ($6k/yr) — positive.
- The deal already cash-flows at list — no discount required.
- Meets the 1% rule at list price ($3k rent vs $209k).
- It's been on market 17 days — a 2% lower offer ($206k) is reasonable based on typical stale-listing flexibility.
- Recommended offer: $206k (1.5% below list) — sets the bar for market timing.
- Local home prices are declining (-3.0%/yr); year-one equity from $1k of loan paydown is wiped out by about $6k of value loss. Plan a longer hold.
- Location reads 82/100 on livability (#13 in CT, #1,301 nationally) — a professional / high-income tenant draw. Strengths: crime A+, employment A+, housing A+; Watch: amenities C-, commute F.
- East Hampton School District (town): math 43% / reading 59% proficiency, ranked #70 of 153 in CT (top 46%) — acceptable for families but not a draw, mixed tenant base, ~2y average lease; only 10% free/reduced lunch — higher-income household profile.
- Watch-outs: built in 1950 — expect roof / HVAC / electrical / plumbing capex.
- Market conditions: 62 active listings in the ZIP; 6 comparable units currently listed for rent nearby; rentals lingering (median 45d on market — plan ~5-8 weeks vacancy on turnover, expect pricing pressure); 50% of comp listings sitting > 30 days — soft ceiling on asking rent; 278 units permitted in Lower Connecticut River Valley Planning Region in 2024 (89 in 5+ unit buildings).
- 2 sale attempts; this cycle's ask has dropped $30k (13%) from the opening price — seller is motivated, your offer sets the floor, not the list.
- Current owner paid $145k; 44% above their basis — modest negotiation headroom, anchor on the comps not their cost.
- Climate carrying-cost: major wind risk, 41% chance of damaging wind over 30y — expect insurance premiums to compound above CPI over the hold.
- Cap rate 9.0% vs local median 2.0% in East Hampton — top-decile yield for the area; either an underpriced asset or a hidden risk that comps aren't pricing in. Stress-test before assuming the spread holds.
Questions for listing agent
- Built in 1950 — when were the roof, HVAC, electrical panel, plumbing, and water heater last replaced?
- Is there a deadline driving the sale (1031 exchange, divorce, estate, relocation)? That informs how much negotiation room exists.
- Schools are B-rated — typically a magnet for longer-tenancy family renters. What's the average tenant stay here, and is there a school-zone premium baked into asking?
- What's the average days-on-market for RENTAL listings here right now (not sales)? A rising rental-DOM trend means longer vacancies and softer asking-rent achievability than the comps imply.
- What's the recent tenant-quality profile in this submarket — average credit score on applications, eviction rate, late-payment / NSF rate, and stable-employment percentage? A property-management company in the area should have these aggregated.
- How much new for-sale + rental construction is in the pipeline within 1–3 miles? Heavy new supply typically softens prices + rents 12–24 months out; constrained supply supports both.
CashFlowRE · CFR-PVS2A09FYTDYEN
· Data 10 h ago
cashflowre.app · 2026-05-29