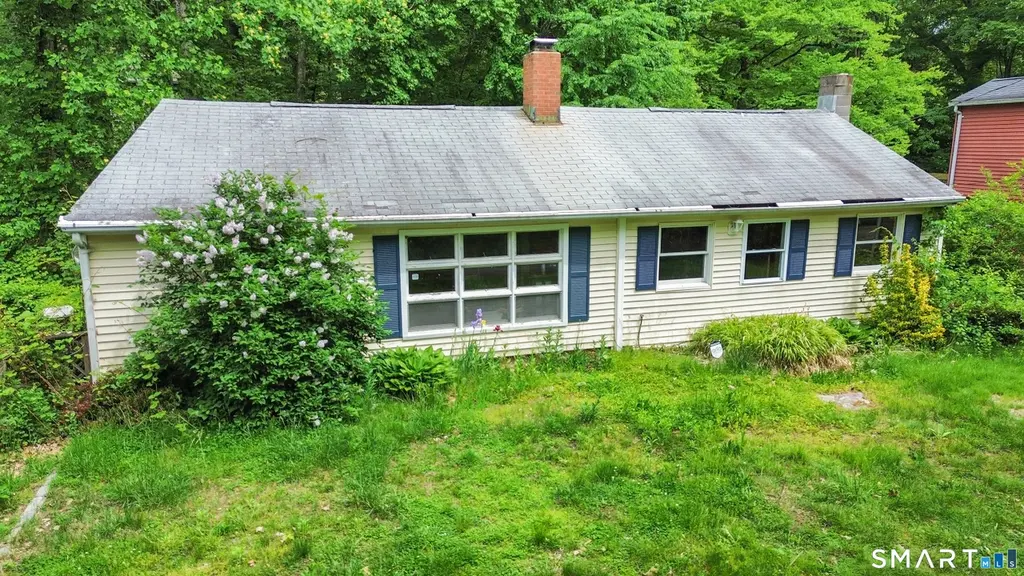
11 Brook Trl · East Hampton, CT
Flood risk 4/10 · Minor
- FEMA flood zone
- X (unshaded)
- Chance of flooding over 30 yrs
- 0.24%
- Est. flood insurance / yr
- $473 – $860
Fire risk 2/10 · Minimal
- Est. fire insurance / yr
- $829 – $1,539
Heat risk 4/10 · Minor
- Hot days now (above 96°F)
- 7 days/yr
- Hot days in 30 yrs
- 16 days/yr
Wind risk 6/10 · Moderate
- Chance of severe wind over 30 yrs
- 41.0%
Air-quality risk 3/10 · Minor
- Unhealthy air days now
- 3 days/yr
- Unhealthy air days in 30 yrs
- 4 days/yr
Risk factors via First Street. Map © Google.
Why this score? — see what drove the B- grade
The composite is a weighted blend of 9 inputs, each scored 0–100. Each bar is that input's sub-score; the figure is the points it added to the 100-point composite (weight × sub-score).
- Cash flow +25.2/30.0
- ARV discount +15.0/15.0
- DSCR +8.3/10.0
- 1% rule +7.4/10.0
- Schools +4.8/10.0
- Livability +4.1/5.0
- Rent growth +2.5/5.0
- Condition / age +2.5/5.0
- Appreciation +0.0/10.0
$209,000
🖨 Deal sheet (PDF) 📄 Offer letter ✓ Due diligence
Listing remarks
A rare blank-slate opportunity on nearly half an acre (0.46 ac) in a quiet East Hampton neighborhood. This 2-bed, 1-bath home offers approximately 1,141 sq ft and has been opened up and prepped for renovation - giving you the freedom to design and finish it exactly the way you want, without working around an existing layout. A great fit for investors, flippers, or hands-on buyers ready to build real equity. The generous lot, established location, and proximity to town, schools, and Lake Pocotopaug recreation make this a strong candidate for the right vision. Comparable renovated homes in the area support attractive upside.
Key facts
- Proximity to schools
- Generous lot
- Proximity to town
Tags
Property features AI
Finance
- Other: Located in Middlesex County, Connecticut; GPS-friendly directions available
Exterior
- Utilities: Private well water; Connected to public sewer; No hot water reported
- Home design: Single-family home
- Construction: Frame construction; Concrete foundation
- Exterior features: Vinyl siding
Interior
- Bedrooms: 2 bedrooms
- Bathrooms: 1 full bathroom
- Heating & cooling: Baseboard heat; No fuel specified for heating
- Interior features: Crawl space basement; One fireplace
Neighborhood map
What this means for you Summary
Snapshot
- This is a 2-bed/1.0-bath single-family listed at $209k.
Deal economics
- At list price, monthly cash flow is $468 ($6k/yr) — positive.
- The deal already cash-flows at list — no discount required.
- Meets the 1% rule at list price ($3k rent vs $209k).
- Recommended offer: $206k (1.5% below list) — sets the bar for market timing.
Location & tenants
- Location reads 82/100 on livability (#13 in CT, #1,301 nationally) — a professional / high-income tenant draw. Strengths: crime A+, employment A+, housing A+; Watch: amenities C-, commute F.
- East Hampton School District (town): math 43% / reading 59% proficiency, ranked #70 of 153 in CT (top 46%) — acceptable for families but not a draw, mixed tenant base, ~2y average lease; only 10% free/reduced lunch — higher-income household profile.
- Market conditions: 62 active listings in the ZIP; 6 comparable units currently listed for rent nearby; rentals lingering (median 45d on market — plan ~5-8 weeks vacancy on turnover, expect pricing pressure); 50% of comp listings sitting > 30 days — soft ceiling on asking rent; 278 units permitted in Lower Connecticut River Valley Planning Region in 2024 (89 in 5+ unit buildings).
Forward outlook
- Local home prices are declining (-3.0%/yr); year-one equity from $1k of loan paydown is wiped out by about $6k of value loss. Plan a longer hold.
Negotiation context
- It's been on market 17 days — a 2% lower offer ($206k) is reasonable based on typical stale-listing flexibility.
- 2 sale attempts; this cycle's ask has dropped $30k (13%) from the opening price — seller is motivated, your offer sets the floor, not the list.
- Current owner paid $145k; 44% above their basis — modest negotiation headroom, anchor on the comps not their cost.
Risks & watch-outs
- Watch-outs: built in 1950 — expect roof / HVAC / electrical / plumbing capex.
- Climate carrying-cost: major wind risk, 41% chance of damaging wind over 30y — expect insurance premiums to compound above CPI over the hold.
Questions for the listing agent
- Built in 1950 — when were the roof, HVAC, electrical panel, plumbing, and water heater last replaced?
- Is there a deadline driving the sale (1031 exchange, divorce, estate, relocation)? That informs how much negotiation room exists.
- Schools are B-rated — typically a magnet for longer-tenancy family renters. What's the average tenant stay here, and is there a school-zone premium baked into asking?
- What's the average days-on-market for RENTAL listings here right now (not sales)? A rising rental-DOM trend means longer vacancies and softer asking-rent achievability than the comps imply.
- What's the recent tenant-quality profile in this submarket — average credit score on applications, eviction rate, late-payment / NSF rate, and stable-employment percentage? A property-management company in the area should have these aggregated.
- How much new for-sale + rental construction is in the pipeline within 1–3 miles? Heavy new supply typically softens prices + rents 12–24 months out; constrained supply supports both.
Investment metrics
- 1% rule
- 1.24% ✓
- Cap rate
- 8.98%
- Cash-on-cash
- 9.59%
- DSCR
- 1.43
- GRM
- 6.7
CMA / ARV
- ARV (on-the-fly)
- $354,851
- Comps found
- 9
Show comp detail 9 sales within ~0.75 mi
| Address | Dist | Beds/Ba | Sqft | Sold | Price | $/sf | Match |
|---|---|---|---|---|---|---|---|
| 19 Wordsworth Rd | 0.16mi | 2/1.5 | 1,100 (-4%) | 8mo | $225,000 | $205 | 78 |
| 5 Seminole Trl | 0.37mi | 2/1.0 | 1,068 (-6%) | 1mo | $302,500 | $283 | 71 |
| 15 Wangonk Trl | 0.18mi | 3/1.5 (+1) | 1,170 (+2%) | 22mo | $555,000 | $474 | 61 |
| 204 E High St | 0.39mi | 2/1.0 | 1,183 (+4%) | 19mo | $254,000 | $215 | 60 |
| 6 Wangonk Trl | 0.14mi | 3/1.0 (+1) | 1,056 (-7%) | 21mo | $333,000 | $315 | 59 |
| 14 Barrie Rd | 0.29mi | 1/1.0 (-1) | 1,008 (-12%) | 10mo | $313,000 | $311 | 54 |
| 15 Barrie Rd | 0.29mi | 3/2.0 (+1) | 1,300 (+14%) | 1mo | $375,000 | $288 | 53 |
| 23 Oneill Ln | 0.46mi | 3/2.0 (+1) | 1,239 (+9%) | 13mo | $669,000 | $540 | 44 |
| 79 Spellman Point Rd | 0.67mi | 3/2.0 (+1) | 1,311 (+15%) | 13mo | $700,000 | $534 | 24 |
Match score weights: distance 35% · size 25% · config 20% · recency 20%. Top-matched comps best support the ARV.
Projected returns pro-forma
-3.0% appreciation · 3.0% rent growth · sell at horizon
- IRR
- -1.8%
- Equity multiple
- 0.93×
- Total profit
- $-3,958
- Equity at exit
- $31,163
- IRR
- 8.0%
- Equity multiple
- 1.60×
- Total profit
- $35,398
- Equity at exit
- $18,071
Cash invested: $58,520 (down + closing). Projections, not guarantees.
Landlord ↔ Tenant lean methodology
- Overall (STATE)
- 27 Tenant-Leaning
- State Connecticut
- 27 Tenant-Leaning · D+7
- County
- — inherits STATE
- City
- — inherits STATE
ZIP-level market 06424
- Home prices YoY
- -34.6%
- Active inventory
- 62
- Price-to-rent
- 6.7×
Monthly cashflow live
- Estimated rent
- $2,586 high interval (Pro) →
- Mortgage (P&I)
- −$1,096
- Tax from tax record
- −$392 /mo · $4,709/yr
- Insurance
- −$87
- HOA
- −$0
- Vacancy / Maint / Mgmt
- −$543
- Net cashflow
- $468
Break-even live
Sensitivity live
| Price | -10% $586 | -5% $527 | +0% $468 | +5% $409 | +10% $349 |
|---|---|---|---|---|---|
| Rent | -10% $263 | -5% $366 | +0% $468 | +5% $570 | +10% $672 |
| Rate | -1.0pp $573 | -0.5pp $521 | base $468 | +0.5pp $414 | +1.0pp $358 |
UW: 25.0% down · 7.5% · 30yr · 1.5% tax · 5.0% vac · 8.0% maint · 8.0% mgmt
Financing live
Cash to close
- Down payment
- $52,250
- Closing costs
- $6,270
- Reserves months
- —
- Total cash needed
- —
Loan-product check · same deal, 3 products live
Conventional
25% down · 7.5% · 30yr
- Down + closing
- —
- Monthly P&I
- —
- Monthly cashflow
- —
- DSCR
- —
- Eligible?
- —
Personal DTI + credit; lowest rate.
DSCR
20% down · 8.5% · 30yr
- Down + closing
- —
- Monthly P&I
- —
- Monthly cashflow
- —
- DSCR
- —
- Eligible?
- —
No personal income docs; deal must DSCR.
Hard money
10% down · 12.0% · 12mo
- Down + closing
- —
- Monthly P&I
- —
- Monthly cashflow
- —
- DSCR
- —
- Eligible?
- —
Short-term bridge; refi at stabilization.
Rent comps 6 comps
| Address | Beds | Baths | Sqft | Rent | $/sqft | DOM | Units | Dist |
|---|---|---|---|---|---|---|---|---|
| 20 Seminole Trl East Hampton, CT | 2.0 | 1.5 | 1000 | $2,900 | $2.90 | 44d | 1 | 0.38mi |
| 502 Edgewater Cir Unit C East Hampton, CT | 2.0 | 2.0 | 1017 | $2,650 | $2.61 | 2d | 1 | 0.56mi |
| 501 Edgewater Cir Unit G East Hampton, CT | 2.0 | 2.0 | 1017 | $2,650 | $2.61 | 2d | 1 | 0.58mi |
| 22 Lakeview St Unit 1 East Hampton, CT | 3.0 | 1.5 | 980 | $2,000 | $2.04 | 24d | 1 | 0.99mi |
| 24 Main St Unit 2 East Hampton, CT | 2.0 | 1.0 | 786 | $1,995 | $2.54 | 45d | 1 | 1.42mi |
| 24 Main St Unit 1 East Hampton, CT | 3.0 | 1.0 | 1009 | $2,395 | $2.37 | 44d | 1 | 1.42mi |
Listing history 14 events
-
2026-06-21days on market $209,000 Active 17 DOM
-
2026-06-18days on market $209,000 Active 15 DOM
-
2026-06-17days on market $209,000 Active 14 DOM
-
2026-06-16days on market $209,000 Active 13 DOM
-
2026-06-16price $209,000 Active 12 DOM
-
2026-06-15days on market $229,000 Active 12 DOM
-
2026-06-13days on market $229,000 Active 10 DOM
-
2026-06-12pricedays on market $229,000 Active 9 DOM
-
2026-06-09days on market $239,000 Active 6 DOM
-
2026-06-08days on market $239,000 Active 5 DOM
-
2026-06-07days on market $239,000 Active 4 DOM
-
2026-06-07days on market $239,000 Active 3 DOM
-
2026-06-04remarks 630-char remark
-
2026-06-04$239,000 Active 1 DOM
ⓘ Source: listings_history table (triggers on properties + properties_extension) + one-shot
backfill from property_details.listing_events for pre-trigger history.
Tax reassessment forecast CT · Partial reset (capped growth)
- Current annual tax
- $4,709 · $392/mo
- Projected year-2 tax
- $4,709 · $392/mo
- Expected delta
- $0/yr ($0/mo · 0.0%)
ⓘ Screening estimate from a state-policy table — verify with the county assessor before closing.
Climate risk First Street
- Flood 4/10 Moderate FEMA zone X (unshaded) · 24% chance over 30 yrs
- Wildfire 2/10 Low
- Heat 4/10 Moderate 7 d/yr ≥96°F today · 16 d/yr by 30 yrs out
- Wind 6/10 Major 41% chance of damaging wind over 30 yrs
- Air quality 3/10 Moderate 3 unhealthy d/yr today · 4 by 30 yrs out
Nearby sold comps map
Loading sold comps map…
Walkable amenities ~0.75 mi
Loading nearby amenities…
Taxation est. · year 1
- Rental income
- $31,037
- − Mortgage interest
- −$11,707
- − Property taxes
- −$4,709
- − Insurance
- −$1,045
- − Repairs & maintenance
- −$2,483
- − Management
- −$2,483
- − Depreciation
- −$6,080
- Taxable income
- $2,529
- Est. tax owed @ 24.0%
- −$607
- After-tax cash flow
- $5,006/yr
For passive investors: Depreciation is non-cash, so a rental often shows a tax loss while cash-flowing — sheltering income. Rental losses are passive: they offset passive income freely, and up to $25,000/yr can offset ordinary (W-2) income if you actively participate and your MAGI is under $100k (phasing out to $0 by $150k); unused losses carry forward. On sale, claimed depreciation is recaptured at up to 25%, and gains may owe capital-gains tax (a 1031 exchange can defer both). Figures are a year-1 estimate at your 24.0% rate — not tax advice; consult a CPA.
Schools (NCES district)
- District
- East Hampton School District
- NCES district ID
- 0901230
- Math proficiency
- 43% ▼ -13.00%
- Reading proficiency
- 59% ▼ -8.00%
- Median HH income
- $91,846
- Composite
- 47.55/100
- National rank
- #2265
- State rank
- #70 of 153 in CT
Livability — East Hampton
- Score
- 82/100
- State rank
- #13
- US rank
- #1301
Category grades
Schools grade is shown separately in the Schools card above.
Census & demographics
- Census place
- Lake Pocotopaug, CT
- Population (ZIP)
- 12,401
Population outlook (Lower Connecticut River Valley County) Hauer SSP2
- By 2040
- 188,651
Race, ethnicity, and origin ACS 2023
- Neighborhood character
- Predominantly White (87%)
- Race & ethnicity
- White 87% Two or more races 6% Hispanic / Latino 6% Asian 3%
- Hispanic origin (detail)
- Puerto Rican 4%
- Common ancestry
- Romanian 11% Lithuanian 4% Italian 4%
- Foreign-born
- 5% · Canada
- Languages at home
- 93% English-only · Other Indo-European 2% Spanish 2% French/Haitian/Cajun 1%
Political lean MEDSL · Lower Connecticut River Valley
- 2024 margin
- D (+13.4) · D 55.9% · R 42.4% · Other 1.7%
- All cycles
- 2024: D+13.4
Not yet ingested
- Civics
- —
Market trends
- HPI YoY
- ▼ -100.67%
- Current HPI
- 190.1694
- Rent YoY
- —
- Metro
- —
- State GDP YoY
- ▲ 1.06%
- F500 in state
- 38
Industry mix (Fortune 500 HQ in CT)
| Industry | F500 HQs | Revenue |
|---|---|---|
| Industrial Machinery | 4 | $38B |
|
||
| Insurance | 3 | $71B |
|
||
| Financial Services | 2 | $25B |
|
||
| Transportation / Logistics | 2 | $18B |
|
||
| Healthcare | 1 | $247B |
|
||
| Telecommunications | 1 | $55B |
|
||
Price history
+143.9% since first listed6 events — show timeline
- 2026-06-03 Listed $239,000 Smart MLS
- 2026-06-02 Listing Removed — Smart MLS
- 2026-06-02 Listed $239,000 Smart MLS
- 2005-06-21 Sold (Public Records) $145,000 Public Records
- 2005-06-21 Sold (Public Records) $145,000 Public Records
- 1998-10-07 Sold (Public Records) $98,000 Public Records
Property tax history
+2.8%/yrLatest (2022): $4,709 · +0.4% YoY. Source: county tax records.
Cash-flow waterfall
monthlySold comps — $/sqft
last 12 mo · ≤1 miLoading sold comps…