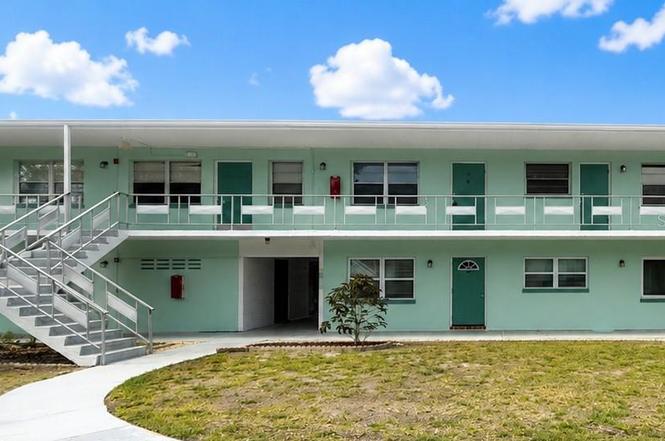
5850 21st St N #15
Lealman, FL 33714
$75,000B-
2 bd · 1.0 ba ·
890 sqft ·
Built 1966
· Condo
· Active
· 3 DOM
Cashflow @ list (25.0% down · 7.5%)
Estimated rent
$1,847/mo
Mortgage (P&I)
−$393
Tax + insurance
−$125
HOA
−$695
Vac / Maint / Mgmt
−$388
Net cashflow
$246/mo
Annual
$2,954/yr
Cap rate
10.23%
Cash-on-cash
14.06%
DSCR
1.63
1% rule
2.46%
Cash to close
$21,000
Investor read
- This is a 2-bed/1.0-bath condo listed at $75k.
- At list price, monthly cash flow is $246 ($3k/yr) — positive.
- The deal already cash-flows at list — no discount required.
- Meets the 1% rule at list price ($2k rent vs $75k).
- Only 3 days on market — expect competitive offers; lowballing is unlikely to land.
- Local home prices are declining (-3.0%/yr); year-one equity from $519 of loan paydown is wiped out by about $2k of value loss. Plan a longer hold.
- Location reads 81/100 on livability (#83 in FL, #1,394 nationally) — a professional / high-income tenant draw. Strengths: commute A+, cost of living A+, housing A+; Watch: crime D+, schools F, employment F.
- Pinellas (suburban): math 51% / reading 51% proficiency, ranked #31 of 73 in FL (top 42%) — acceptable for families but not a draw, mixed tenant base, ~2y average lease.
- Watch-outs: HOA is 38% of rent.
- Market conditions: Rents soft (-2.1%/yr); 165 active listings in the ZIP; 40 comparable units currently listed for rent nearby; rentals at typical pace (median 22d on market — plan ~3-4 weeks tenant-placement turnaround); 2,676 units permitted in Pinellas County in 2024 (1,422 in 5+ unit buildings).
- Pinellas County population projected at +14% by 2050 — modest demand growth; plan on rents tracking national, not racing it.
- Current owner paid $17k; list at $75k implies a 341% gain — meaningful room to come down on a strong offer.
- Climate carrying-cost: severe wind risk, 99% chance of damaging wind over 30y; extreme-heat days projected 7→28/yr by 2055 (HVAC capex compounding) — expect insurance premiums to compound above CPI over the hold.
- Cap rate 10.2% vs local median 4.7% in Lealman — top-decile yield for the area; either an underpriced asset or a hidden risk that comps aren't pricing in. Stress-test before assuming the spread holds.
- At $1,847/mo this rent would consume 47% of the median local household income ($47k/yr) (locally 915% of renters already pay >50% of income on rent) — very limited rent-growth headroom before tenants either downsize or default.
Questions for listing agent
- Built in 1966 — when were the roof, HVAC, electrical panel, plumbing, and water heater last replaced?
- What does the HOA fee cover, when was the last increase, and are there any pending special assessments or reserve-fund shortfalls?
- Any open or pending special assessments — roof, HVAC, plumbing, elevator, façade? What's the per-unit balance and payoff schedule, and is the seller paying it off at close or rolling it to the buyer?
- Is there a deadline driving the sale (1031 exchange, divorce, estate, relocation)? That informs how much negotiation room exists.
- Schools are F-rated, which usually means shorter tenancies and higher turnover. Who's the typical renter profile here, and what's been the actual vacancy rate?
- Crime grade is D in this area — have there been break-ins, vandalism, or insurance claims at this property in the last 3 years? What carrier currently insures it and at what premium?
- What's the average days-on-market for RENTAL listings here right now (not sales)? A rising rental-DOM trend means longer vacancies and softer asking-rent achievability than the comps imply.
- What's the recent tenant-quality profile in this submarket — average credit score on applications, eviction rate, late-payment / NSF rate, and stable-employment percentage? A property-management company in the area should have these aggregated.
CashFlowRE · CFR-PW3SB18RJSRCZ6
· Data 2 days ago
cashflowre.app · 2026-05-29