5850 21st St N #15 · Lealman, FL
Flood risk 4/10 · Minor
- FEMA flood zone
- X (unshaded)
- Chance of flooding over 30 yrs
- 0.13%
- Est. flood insurance / yr
- $507 – $1,088
Fire risk 1/10 · Minimal
- Est. fire insurance / yr
- $947 – $1,759
Heat risk 10/10 · Severe
- Hot days now (above 106°F)
- 7 days/yr
- Hot days in 30 yrs
- 28 days/yr
Wind risk 10/10 · Severe
- Chance of severe wind over 30 yrs
- 99.0%
Air-quality risk 4/10 · Minor
- Unhealthy air days now
- 4 days/yr
- Unhealthy air days in 30 yrs
- 4 days/yr
Risk factors via First Street. Map © Google.
Why this score? — see what drove the B- grade
The composite is a weighted blend of 9 inputs, each scored 0–100. Each bar is that input's sub-score; the figure is the points it added to the 100-point composite (weight × sub-score).
- Cash flow +28.5/30.0
- 1% rule +10.0/10.0
- DSCR +10.0/10.0
- ARV discount +7.5/15.0
- Schools +4.3/10.0
- Livability +4.0/5.0
- Condition / age +2.5/5.0
- Rent growth +2.0/5.0
- Appreciation +0.0/10.0
$75,000
🖨 Deal sheet 📄 Offer letter ✓ Due diligence
Listing remarks MLS
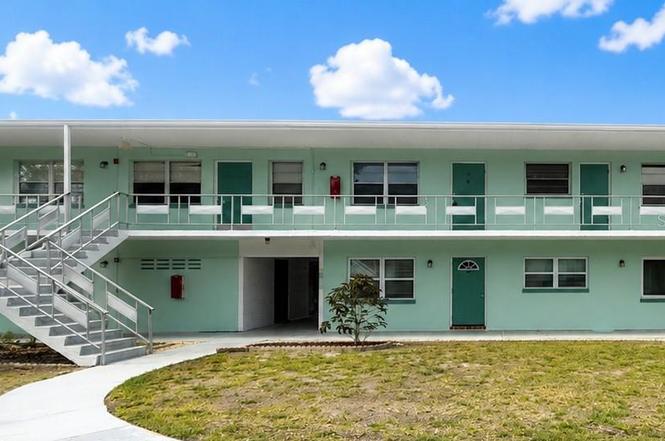
This just in! This spacious 2 Bedroom condo is waiting for its new owner and their creative vision! The living room is ample in size, and is an easy space to make your own! The Dining Room is set off the Galley Kitchen, the perfect layout for easy meals. Passing through the Kitchen leads you to the expansive Florida Room. The Florida Room runs the length of the entire unit, and houses a large storage closet. Both Bedrooms are set off the right-side of the living areas, with the Master Bedroom being set back from the front. The Master Bedroom has plenty of room for a king-sized bed as well as several dressers, and still offers a large built-in closet. The Second Bedroom is also generous in size, and provides a second door to the front entryway! The amenities are unbeatable -- the laundry facilities are key-entry only and are very clean! Enjoy the beautiful community pool and recreation building, shuffleboard, and peaceful pond, all resting in the middle of the entire community for ultimate privacy. Only minutes to grocery shopping and restaurants, a 25-minute drive to Tampa Int'l, a 10-minute drive to beautiful downtown St. Petersburg, a 25-minute drive to beautiful Treasure Island -- you are in the heart of what makes Florida Living the finest!! X FLOOD ZONE, 2nd story high & dry unit!! Carport Space #15! With a fresh coat of paint in your colors of choice, you can transform this home into your Florida dream!
Key facts
- Community pool
- Florida room
- Shuffleboard
Tags
Neighborhood map
What this means for you Summary
Snapshot
- This is a 2-bed/1.0-bath condo listed at $75k.
Deal economics
- At list price, monthly cash flow is $246 ($3k/yr) — positive.
- The deal already cash-flows at list — no discount required.
- Meets the 1% rule at list price ($2k rent vs $75k).
- Cap rate 10.2% vs local median 4.7% in Lealman — top-decile yield for the area; either an underpriced asset or a hidden risk that comps aren't pricing in. Stress-test before assuming the spread holds.
Location & tenants
- Location reads 81/100 on livability (#83 in FL, #1,394 nationally) — a professional / high-income tenant draw. Strengths: commute A+, cost of living A+, housing A+; Watch: crime D+, schools F, employment F.
- Pinellas (suburban): math 51% / reading 51% proficiency, ranked #31 of 73 in FL (top 42%) — acceptable for families but not a draw, mixed tenant base, ~2y average lease.
- Market conditions: Rents soft (-2.1%/yr); 165 active listings in the ZIP; 40 comparable units currently listed for rent nearby; rentals at typical pace (median 22d on market — plan ~3-4 weeks tenant-placement turnaround); 2,676 units permitted in Pinellas County in 2024 (1,422 in 5+ unit buildings).
- At $1,847/mo this rent would consume 47% of the median local household income ($47k/yr) (locally 915% of renters already pay >50% of income on rent) — very limited rent-growth headroom before tenants either downsize or default.
Forward outlook
- Local home prices are declining (-3.0%/yr); year-one equity from $519 of loan paydown is wiped out by about $2k of value loss. Plan a longer hold.
- Pinellas County population projected at +14% by 2050 — modest demand growth; plan on rents tracking national, not racing it.
Negotiation context
- Only 3 days on market — expect competitive offers; lowballing is unlikely to land.
- Current owner paid $17k; list at $75k implies a 341% gain — meaningful room to come down on a strong offer.
Risks & watch-outs
- Watch-outs: HOA is 38% of rent.
- Climate carrying-cost: severe wind risk, 99% chance of damaging wind over 30y; extreme-heat days projected 7→28/yr by 2055 (HVAC capex compounding) — expect insurance premiums to compound above CPI over the hold.
Questions for the listing agent
- Built in 1966 — when were the roof, HVAC, electrical panel, plumbing, and water heater last replaced?
- What does the HOA fee cover, when was the last increase, and are there any pending special assessments or reserve-fund shortfalls?
- Any open or pending special assessments — roof, HVAC, plumbing, elevator, façade? What's the per-unit balance and payoff schedule, and is the seller paying it off at close or rolling it to the buyer?
- Is there a deadline driving the sale (1031 exchange, divorce, estate, relocation)? That informs how much negotiation room exists.
- Schools are F-rated, which usually means shorter tenancies and higher turnover. Who's the typical renter profile here, and what's been the actual vacancy rate?
- Crime grade is D in this area — have there been break-ins, vandalism, or insurance claims at this property in the last 3 years? What carrier currently insures it and at what premium?
- What's the average days-on-market for RENTAL listings here right now (not sales)? A rising rental-DOM trend means longer vacancies and softer asking-rent achievability than the comps imply.
- What's the recent tenant-quality profile in this submarket — average credit score on applications, eviction rate, late-payment / NSF rate, and stable-employment percentage? A property-management company in the area should have these aggregated.
- How much new apartment / multifamily construction is in the pipeline within 1–3 miles? Heavy new supply (>2% of stock underway) typically softens rents 12–24 months out; light construction supports rent growth.
Investment metrics
- 1% rule
- 2.46% ✓
- Cap rate
- 10.23%
- Cash-on-cash
- 14.06%
- DSCR
- 1.63
- GRM
- 3.4
CMA / ARV
No comps found within radius.
Projected returns pro-forma
-3.0% appreciation · 0.0% rent growth · sell at horizon
- IRR
- -1.9%
- Equity multiple
- 0.93×
- Total profit
- $-1,436
- Equity at exit
- $11,183
- IRR
- -0.1%
- Equity multiple
- 0.99×
- Total profit
- $-139
- Equity at exit
- $6,485
Cash invested: $21,000 (down + closing). Projections, not guarantees.
Landlord ↔ Tenant lean methodology
- Overall (STATE)
- 87 Strongly Landlord-Friendly
- State Florida
- 87 Strongly Landlord-Friendly · R+3
- County
- — inherits STATE
- City
- — inherits STATE
ZIP-level market 33714
- Home prices YoY
- -30.9%
- Rents YoY
- -2.1%
- Active inventory
- 165
- Price-to-rent
- 3.4×
Monthly cashflow live
- Estimated rent
- $1,847 high interval (Pro) →
- Mortgage (P&I)
- −$393
- Tax est. 1.5%
- −$94 /mo · $1,125/yr
- Insurance
- −$31
- HOA
- −$695
- Vacancy / Maint / Mgmt
- −$388
- Net cashflow
- $246
Break-even live
UW: 25.0% down · 7.5% · 30yr · 1.5% tax · 5.0% vac · 8.0% maint · 8.0% mgmt
Financing live
Cash to close
- Down payment
- $18,750
- Closing costs
- $2,250
- Reserves months
- —
- Total cash needed
- —
Loan-product check · same deal, 3 products live
Conventional
25% down · 7.5% · 30yr
- Down + closing
- —
- Monthly P&I
- —
- Monthly cashflow
- —
- DSCR
- —
- Eligible?
- —
Personal DTI + credit; lowest rate.
DSCR
20% down · 8.5% · 30yr
- Down + closing
- —
- Monthly P&I
- —
- Monthly cashflow
- —
- DSCR
- —
- Eligible?
- —
No personal income docs; deal must DSCR.
Hard money
10% down · 12.0% · 12mo
- Down + closing
- —
- Monthly P&I
- —
- Monthly cashflow
- —
- DSCR
- —
- Eligible?
- —
Short-term bridge; refi at stabilization.
Rent comps 40 comps
| Address | Beds | Baths | Sqft | Rent | $/sqft | DOM | Units | Dist |
|---|---|---|---|---|---|---|---|---|
| 5850 18th St N St Petersburg, FL | 1.0–2.0 | 1.0–2.0 | 727 | $1,400 | $1.92 | 24d | 2 | 0.21mi |
| 5920 18th St N #14 Saint Petersburg, FL | 2.0 | 2.0 | 950 | $1,400 | $1.47 | 24d | 1 | 0.24mi |
| 5850 18th St N #23 Saint Petersburg, FL | 2.0 | 2.0 | 870 | $1,400 | $1.61 | 17d | 1 | 0.24mi |
| 2275 62nd Ave N #203 St Petersburg, FL | 2.0 | 2.0 | 940 | $1,975 | $2.10 | 24d | 1 | 0.38mi |
| 5924 15th Way N Saint Petersburg, FL | 3.0 | 2.0 | 1104 | $3,200 | $2.90 | 4d | 1 | 0.47mi |
| 2734 62nd Ave N Apt 3 St. Petersburg, FL | 2.0 | 1.5 | 833 | $1,895 | $2.27 | 24d | 1 | 0.56mi |
| 2600 52nd Ave N Unit B St. Petersburg, FL | 2.0 | 2.0 | 857 | $2,275 | $2.65 | 2d | 1 | 0.60mi |
| 2600 52nd Ave N Unit A St. Petersburg, FL | 2.0 | 2.0 | 1018 | $2,225 | $2.19 | 2d | 1 | 0.60mi |
| 2715 63rd Ter N Unit B St. Petersburg, FL | 2.0 | 2.0 | 1030 | $1,900 | $1.84 | 24d | 1 | 0.60mi |
| 4660 24th St N Saint Petersburg, FL | 3.0 | 1.0 | 600 | $2,250 | $3.75 | 24d | 1 | 0.74mi |
| 1145 54th Ave N Saint Petersburg, FL | 2.0 | 1.0 | 810 | $1,850 | $2.28 | 24d | 1 | 0.75mi |
| 3114 58th Ave N Saint Petersburg, FL | 2.0 | 1.0 | 800 | $1,950 | $2.44 | 3d | 1 | 0.88mi |
| 3132 56th Ave N Saint Petersburg, FL | 3.0 | 2.0 | 1063 | $2,850 | $2.68 | 24d | 1 | 0.90mi |
| 4481 Crestwood Dr N Saint Petersburg, FL | 2.0 | 1.0 | 720 | $1,950 | $2.71 | 3d | 1 | 0.90mi |
| 5200 28th St N Unit 628 St. Petersburg, FL | 2.0 | 1.0 | 872 | $2,200 | $2.52 | 24d | 1 | 0.90mi |
| 5200 28th St N Unit 402 St. Petersburg, FL | 2.0 | 2.0 | 850 | $1,995 | $2.35 | 16d | 1 | 0.90mi |
| 7260 17th Way N Saint Petersburg, FL | 3.0 | 1.0 | 912 | $3,650 | $4.00 | 4d | 1 | 0.93mi |
| 6910 Dr Martin Luther King Jr St N Saint Petersburg, FL | 2.0 | 1.0 | 780 | $1,850 | $2.37 | 24d | 1 | 1.14mi |
| 660 62nd Ave N #1204 Saint Petersburg, FL | 1.0 | 1.0 | 656 | $1,400 | $2.13 | 23d | 1 | 1.18mi |
| 4104 1/2 Haines Rd N Unit 1 St. Petersburg, FL | 2.0 | 1.0 | 1000 | $1,850 | $1.85 | 24d | 1 | 1.19mi |
| 2519 39th Ave N Saint Petersburg, FL | 3.0 | 2.0 | 1005 | $2,750 | $2.74 | 24d | 1 | 1.25mi |
| 3584 54th Ave N Saint Petersburg, FL | 3.0 | 1.0 | 1012 | $1,950 | $1.93 | 4d | 1 | 1.26mi |
| 5519 Commonwealth Ave N Saint Petersburg, FL | 2.0 | 1.0 | 852 | $2,900 | $3.40 | 4d | 1 | 1.27mi |
| 4163 31st St N unit Unit D Saint Petersburg, FL | 1.0 | 1.0 | 600 | $1,490 | $2.48 | 13d | 1 | 1.32mi |
| 3725 18th St N Saint Petersburg, FL | 2.0 | 1.0 | 700 | $1,795 | $2.56 | 16d | 1 | 1.32mi |
| 3580 49th Ave N St. Petersburg, FL | 2.0 | 1.0 | 790 | $1,425 | $1.80 | 3d | 1 | 1.33mi |
| 3560 49th Ave N St. Petersburg, FL | 2.0 | 1.0 | 790 | $1,425 | $1.80 | 11d | 1 | 1.34mi |
| 3560 49th Ave N St. Petersburg, FL | 2.0 | 1.0 | 790 | $1,425 | $1.80 | 13d | 1 | 1.34mi |
| 3600 49th Ave N Saint Petersburg, FL | 1.0–2.0 | 1.0 | 680 | $1,600 | $2.35 | 3d | 8 | 1.34mi |
| 209 NW Jefferson Cir N Unit 15 St. Petersburg, FL | 2.0 | 1.0 | 740 | $1,275 | $1.72 | 24d | 1 | 1.35mi |
| 209 NW Jefferson Cir N Unit JEFFERSON209-15 St. Petersburg, FL | 2.0 | 1.0 | 740 | $1,275 | $1.72 | 2d | 1 | 1.35mi |
| 4129 32nd St N Unit B St. Petersburg, FL | 3.0 | 1.0 | 1000 | $2,150 | $2.15 | 24d | 1 | 1.36mi |
| 550 50th Ave N Saint Petersburg, FL | 2.0 | 1.0 | 765 | $1,700 | $2.22 | 7d | 2 | 1.37mi |
| 5364 4th St N St. Petersburg, FL | 1.0 | 1.0 | 570 | $1,150 | $2.02 | 24d | 1 | 1.39mi |
| 426 Palm Ave N Unit 9 St. Petersburg, FL | 2.0 | 1.0 | 850 | $1,500 | $1.76 | 24d | 1 | 1.39mi |
| 3715 66th Ave N Unit B Pinellas Park, FL | 2.0 | 1.0 | 750 | $1,475 | $1.97 | 21d | 1 | 1.45mi |
| 547 46th Ave N Saint Petersburg, FL | 2.0 | 1.0 | 837 | $2,000 | $2.39 | 7d | 1 | 1.46mi |
| 2730 37th Ave N Unit B St. Petersburg, FL | 1.0 | 1.0 | 560 | $1,590 | $2.84 | 24d | 1 | 1.46mi |
| 440 50th Ave N Saint Petersburg, FL | 1.0 | 1.0 | 825 | $2,100 | $2.55 | 24d | 1 | 1.46mi |
| 3700 Haines Rd N St Petersburg, FL | 1.0–2.0 | 1.0 | 675 | $1,950 | $2.89 | 14d | 2 | 1.49mi |
HOA detail condo
- Monthly dues
- $695 · $8,340/yr
- Likely covers
- pool
- Assessments
- None detected in remarks — confirm with the listing agent.
Listing history 4 events
-
2026-06-18days on market $75,000 Active 3 DOM
-
2026-06-17days on market $75,000 Active 2 DOM
-
2026-06-16remarks 699-char remark
-
2026-06-16$75,000 Active 1 DOM
ⓘ Source: listings_history table (triggers on properties + properties_extension) + one-shot
backfill from property_details.listing_events for pre-trigger history.
Climate risk First Street
- Flood 4/10 Moderate FEMA zone X (unshaded) · 13% chance over 30 yrs
- Wildfire 1/10 Low
- Heat 10/10 Extreme 7 d/yr ≥106°F today · 28 d/yr by 30 yrs out
- Wind 10/10 Extreme 99% chance of damaging wind over 30 yrs
- Air quality 4/10 Moderate 4 unhealthy d/yr today · 4 by 30 yrs out
Nearby sold comps map
Loading sold comps map…
Walkable amenities ~0.75 mi
Loading nearby amenities…
Taxation est. · year 1
- Rental income
- $22,169
- − Mortgage interest
- −$4,201
- − Property taxes
- −$1,125
- − Insurance
- −$375
- − Repairs & maintenance
- −$1,773
- − Management
- −$1,773
- − HOA
- −$8,340
- − Depreciation
- −$2,182
- Taxable income
- $2,399
- Est. tax owed @ 24.0%
- −$576
- After-tax cash flow
- $2,378/yr
For passive investors: Depreciation is non-cash, so a rental often shows a tax loss while cash-flowing — sheltering income. Rental losses are passive: they offset passive income freely, and up to $25,000/yr can offset ordinary (W-2) income if you actively participate and your MAGI is under $100k (phasing out to $0 by $150k); unused losses carry forward. On sale, claimed depreciation is recaptured at up to 25%, and gains may owe capital-gains tax (a 1031 exchange can defer both). Figures are a year-1 estimate at your 24.0% rate — not tax advice; consult a CPA.
Schools (NCES district)
- District
- Pinellas
- NCES district ID
- 1201560
- Math proficiency
- 51% ▼ -5.00%
- Reading proficiency
- 51% ▼ -3.00%
- Median HH income
- $46,270
- Composite
- 43.27/100
- National rank
- #3046
- State rank
- #31 of 73 in FL
Livability — Lealman
- Score
- 81/100
- State rank
- #83
- US rank
- #1394
Category grades
Schools grade is shown separately in the Schools card above.
Census & demographics
- Census place
- Lealman, FL
- County
- Pinellas County · 939,478 people
- City population
- 20,103
- Metro
- Tampa-St. Petersburg-Clearwater, FL
- Population (ZIP)
- 19,227
- Household income
- $47,487
- Rent vs Own
- Severe rent burden
- 915.0
Population outlook (Pinellas County) Hauer SSP2
- Today (2025)
- 1,027,532 people
- By 2030
- 1,063,586 · +3.5%
- By 2040
- 1,125,020 · +9.5%
- By 2050
- 1,168,637 · +13.7%
- By 2075
- 1,265,188 · +23.1%
- By 2100
- 1,260,357 · +22.7%
Race, ethnicity, and origin ACS 2023
- Neighborhood character
- Diverse neighborhood (Simpson 0.55)
- Race & ethnicity
- White 64% Hispanic / Latino 13% Two or more races 12% Black 10% Asian 6%
- Hispanic origin (detail)
- Mexican 2% Puerto Rican 2% Cuban 6% Dominican 1%
- Common ancestry
- Slovak 2% Italian 2% Romanian 2%
- Foreign-born
- 16% · Canada, Vietnam
- Languages at home
- 79% English-only · Spanish 11% Russian/Polish/Slavic 4% Vietnamese 3%
Political lean MEDSL · Pinellas
- 2024 margin
- Lean R (+5.2) · D 46.9% · R 52.1%
- 2008→2024 swing
- -13.5pp toward R · 2008: 8.3pp · 2024: -5.2pp
- All cycles
- 2024: R+5.2 2020: D+0.2 2016: R+1.1 2012: D+5.6 2008: D+8.3
Not yet ingested
- Civics
- —
Market trends
- HPI YoY
- ▼ -179.12%
- Current HPI
- 399.6253
- Rent YoY
- ▼ -2.08%
- Metro
- Tampa-St. Petersburg-Clearwater, FL
- State GDP YoY
- ▲ 3.28%
- F500 in state
- 36
Industry mix (Fortune 500 HQ in FL)
| Industry | F500 HQs | Revenue |
|---|---|---|
| Industrial Technology | 2 | $29B |
|
||
| Insurance | 2 | $17B |
|
||
| Retail | 1 | $60B |
|
||
| Technology Distribution | 1 | $58B |
|
||
| Homebuilding | 1 | $35B |
|
||
| Technology Manufacturing | 1 | $35B |
|
||
Price history
+158.6% since first listed4 events — show timeline
- 2026-06-15 Listed $75,000 Stellar MLS as Distributed by MLS Grid
- 2012-02-17 Sold (Public Records) $17,000 Public Records
- 1999-06-04 Sold (Public Records) $31,500 Public Records
- 1986-12-01 Sold (Public Records) $29,000 Public Records
Property tax history
-13.9%/yrLatest (2025): $67 · +7.0% YoY. Source: county tax records.
Cash-flow waterfall
monthlySold comps — $/sqft
last 12 mo · ≤1 miLoading sold comps…