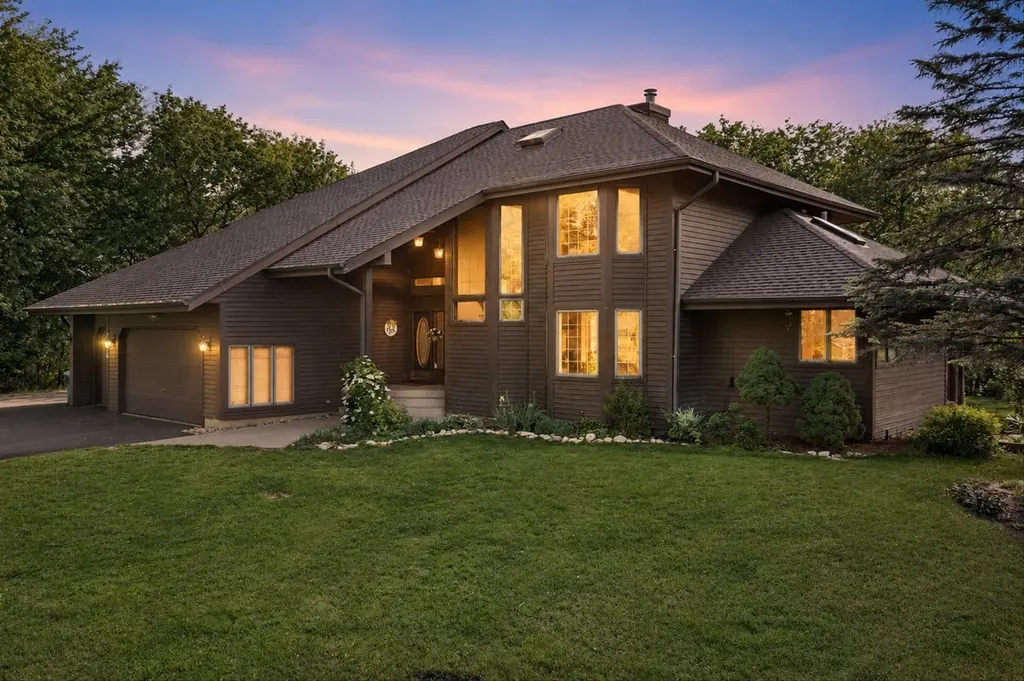
1370 Dunns Ct
Fox Lake, IL 60020
$679,900F
3 bd · 4.0 ba ·
4,383 sqft ·
Built 1998
· SingleFamily
· Active
· 26 DOM
Cashflow @ list (25.0% down · 7.5%)
Estimated rent
$1,998/mo
Mortgage (P&I)
−$3,565
Tax + insurance
−$1,405
HOA
−$27
Vac / Maint / Mgmt
−$420
Net cashflow
$-3,419/mo
Annual
$-41,030/yr
Cap rate
0.26%
Cash-on-cash
-21.55%
DSCR
0.04
1% rule
0.29%
Cash to close
$190,372
Investor read
- This is a 3-bed/4.0-bath single-family listed at $680k.
- At list price, monthly cash flow is $-3k ($-41k/yr) — negative.
- To cash-flow at today's rent, offer at most $225k (67.0% below list).
- To meet the 1% rule (rent ≥ 1% of price), the offer needs to be $200k (70.6% below list).
- It's been on market 26 days — a 2% lower offer ($670k) is reasonable based on typical stale-listing flexibility.
- Recommended offer: $200k (70.6% below list) — sets the bar for 1% rule.
- Local home prices are declining (-3.0%/yr); year-one equity from $5k of loan paydown is wiped out by about $20k of value loss. Plan a longer hold.
- Location reads 74/100 on livability (#247 in IL, #4,462 nationally) — a middle-class / working-renter tenant base. Strengths: cost of living A+, housing A+, commute A; Watch: amenities D+, health & safety F.
- Grant Chsd 124 (suburban): math 23% / reading 27% proficiency, ranked #296 of 620 in IL (top 48%) — low school quality limits family demand, transient renter base, plan for 1-2y turnover.
- Zoned schools: Grant Community High School (math 23% / reading 27%, grade F, #247 of 693 statewide, top 36%, 1,837 students, 0% FRL).
- Market conditions: 78 active listings in the ZIP; 948 units permitted in Lake County in 2024 (424 in 5+ unit buildings).
- Lake County population projected to shrink 8% by 2050 — rents likely to lag national; underwrite the cash flow, not the appreciation.
- 6 sale attempts since 8y ago with the ask held roughly flat each time — persistent listings suggest the price (not the market) is what's stuck; bring a comps-based counter.
- Current owner paid $282k; list at $680k implies a 141% gain — meaningful room to come down on a strong offer.
- Cap rate 0.3% vs local median 6.0% in Fox Lake — below-typical yield; the buyer is paying a premium for something (appreciation thesis, condition, location) that the cap rate doesn't capture.
Questions for listing agent
- What do current leases actually rent for vs. the listed asking? Can we see a recent rent roll and the last 12 months of T-12 income?
- What does the HOA fee cover, when was the last increase, and are there any pending special assessments or reserve-fund shortfalls?
- Is there a deadline driving the sale (1031 exchange, divorce, estate, relocation)? That informs how much negotiation room exists.
- Schools are F-rated, which usually means shorter tenancies and higher turnover. Who's the typical renter profile here, and what's been the actual vacancy rate?
- The area grade is low — what's the realistic commute time and amenity access for the typical tenant pool here? Any planned neighborhood developments (good or bad) we should know about?
- What's the average days-on-market for RENTAL listings here right now (not sales)? A rising rental-DOM trend means longer vacancies and softer asking-rent achievability than the comps imply.
- What's the recent tenant-quality profile in this submarket — average credit score on applications, eviction rate, late-payment / NSF rate, and stable-employment percentage? A property-management company in the area should have these aggregated.
- How much new for-sale + rental construction is in the pipeline within 1–3 miles? Heavy new supply typically softens prices + rents 12–24 months out; constrained supply supports both.
CashFlowRE · CFR-PWVGFD8Q4SW69J
· Data 2 days ago
cashflowre.app · 2026-05-29