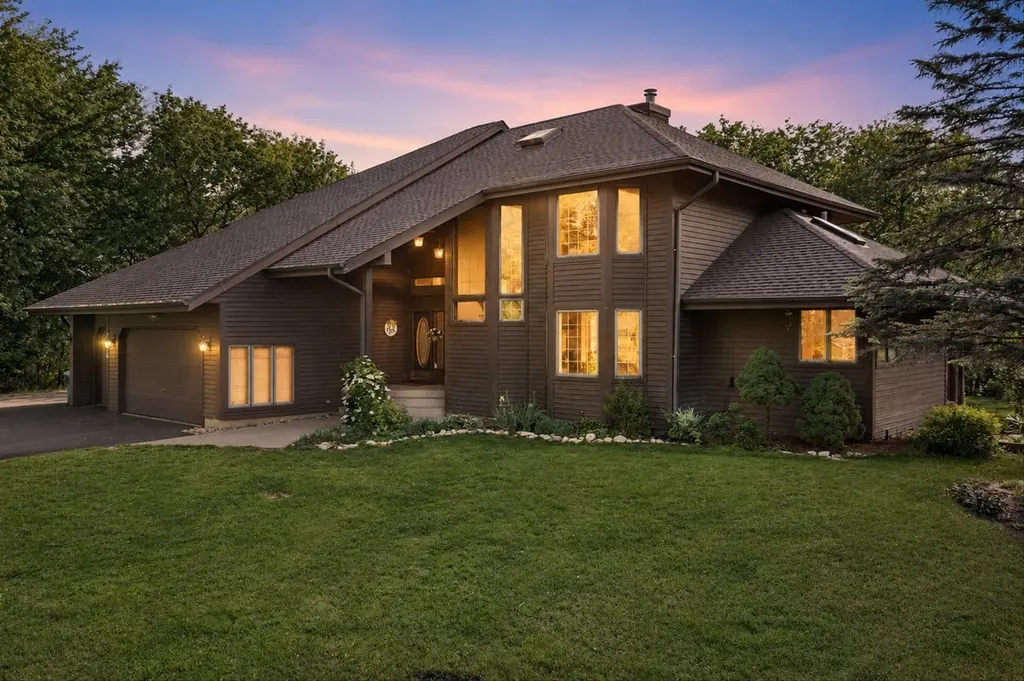
1370 Dunns Ct · Fox Lake, IL
Flood risk 1/10 · Minimal
- FEMA flood zone
- X (unshaded)
- Chance of flooding over 30 yrs
- 0.0%
- Est. flood insurance / yr
- $473 – $860
Fire risk 3/10 · Minor
- Est. fire insurance / yr
- $804 – $1,492
Heat risk 2/10 · Minimal
- Hot days now (above 101°F)
- 7 days/yr
- Hot days in 30 yrs
- 14 days/yr
Wind risk 2/10 · Minimal
- Chance of severe wind over 30 yrs
- —
Air-quality risk 2/10 · Minimal
- Unhealthy air days now
- 1 days/yr
- Unhealthy air days in 30 yrs
- 1 days/yr
Risk factors via First Street. Map © Google.
Why this score? — see what drove the F grade
The composite is a weighted blend of 9 inputs, each scored 0–100. Each bar is that input's sub-score; the figure is the points it added to the 100-point composite (weight × sub-score).
- ARV discount +7.2/15.0
- Livability +3.7/5.0
- Rent growth +2.5/5.0
- Condition / age +2.5/5.0
- Schools +2.3/10.0
- Cash flow +0.0/30.0
- 1% rule +0.0/10.0
- DSCR +0.0/10.0
- Appreciation +0.0/10.0
$679,900
🖨 Deal sheet 📄 Offer letter ✓ Due diligence
Listing remarks
Tucked away on a quiet cul-de-sac in Dunn's Lake Estates, this custom-built home sits on 1.25 private acres offering the perfect blend of privacy, luxury, and lake lifestyle living. Soaring ceilings and a dramatic wall of windows fill the home with natural light while overlooking the expansive deck, firepit, and peaceful backyard retreat. The spacious kitchen offers oak cabinetry, a center island, and generous dining space ideal for entertaining. Upstairs features 3 bedrooms including a spacious primary suite with a walk-in closet, private bath, and balcony retreat. Main floor office or 4th bedroom offers added flexibility. Fully finished basement with family room, bar area, full bathroom a
Key facts
- Private acres
- Oak cabinetry
- Firepit
Tags
Property features AI
Finance
- Other: School bus service; Parcel number on file
- HOA & community: Annual association fee ($325) covering insurance and lake rights; Community amenities include lake access, dock, curbs, street lights and paved streets
Exterior
- Parking: Attached garage with garage door opener; Asphalt driveway; 3 garage/total parking spaces
- Security: Carbon monoxide detectors
- Utilities: Public water; Public sewer; 200+ amp electrical service with circuit breakers
- Home design: Detached single-family home; Two stories; Custom model; Fee-simple ownership with homeowner association
- Construction: Built approximately 26–30 years ago; Brick and cedar exterior; Asphalt roof; Concrete perimeter foundation
- Exterior features: Large deck; Boat slip; Wooded lot; Cul-de-sac location; Water rights
Interior
- Kitchen: Island, breakfast bar and eating area; Range, microwave, dishwasher, refrigerator; Stainless steel appliances; Disposal
- Bedrooms: 4 bedrooms (master suite on the second floor; other bedrooms on main and second levels)
- Flooring: Hardwood flooring in main living areas; Carpet in bedrooms and closets
- Bathrooms: 4 full bathrooms; Soaking tub, separate shower, double sinks
- Heating & cooling: Natural gas forced-air heating; Central air conditioning; Humidifier; CO detectors; Radon mitigation system
- Interior features: First-floor bedroom and first-floor full bath; Walk-in closets; Beamed ceilings; Skylights and window screens; Finished full basement with recreation/family area; Separate dining room
- Laundry & utility: Main-level laundry; Washer and dryer included; Water-softener (owned), sump pump
Neighborhood map
What this means for you Summary
Snapshot
- This is a 3-bed/4.0-bath single-family listed at $680k.
Deal economics
- At list price, monthly cash flow is $-3k ($-41k/yr) — negative.
- To cash-flow at today's rent, offer at most $225k (67.0% below list).
- To meet the 1% rule (rent ≥ 1% of price), the offer needs to be $200k (70.6% below list).
- Recommended offer: $200k (70.6% below list) — sets the bar for 1% rule.
- Cap rate 0.3% vs local median 6.0% in Fox Lake — below-typical yield; the buyer is paying a premium for something (appreciation thesis, condition, location) that the cap rate doesn't capture.
Location & tenants
- Location reads 74/100 on livability (#247 in IL, #4,462 nationally) — a middle-class / working-renter tenant base. Strengths: cost of living A+, housing A+, commute A; Watch: amenities D+, health & safety F.
- Grant Chsd 124 (suburban): math 23% / reading 27% proficiency, ranked #296 of 620 in IL (top 48%) — low school quality limits family demand, transient renter base, plan for 1-2y turnover.
- Zoned schools: Grant Community High School (math 23% / reading 27%, grade F, #247 of 693 statewide, top 36%, 1,837 students, 0% FRL).
- Market conditions: 78 active listings in the ZIP; 948 units permitted in Lake County in 2024 (424 in 5+ unit buildings).
Forward outlook
- Local home prices are declining (-3.0%/yr); year-one equity from $5k of loan paydown is wiped out by about $20k of value loss. Plan a longer hold.
- Lake County population projected to shrink 8% by 2050 — rents likely to lag national; underwrite the cash flow, not the appreciation.
Negotiation context
- It's been on market 26 days — a 2% lower offer ($670k) is reasonable based on typical stale-listing flexibility.
- 6 sale attempts since 8y ago with the ask held roughly flat each time — persistent listings suggest the price (not the market) is what's stuck; bring a comps-based counter.
- Current owner paid $282k; list at $680k implies a 141% gain — meaningful room to come down on a strong offer.
Questions for the listing agent
- What do current leases actually rent for vs. the listed asking? Can we see a recent rent roll and the last 12 months of T-12 income?
- What does the HOA fee cover, when was the last increase, and are there any pending special assessments or reserve-fund shortfalls?
- Is there a deadline driving the sale (1031 exchange, divorce, estate, relocation)? That informs how much negotiation room exists.
- Schools are F-rated, which usually means shorter tenancies and higher turnover. Who's the typical renter profile here, and what's been the actual vacancy rate?
- The area grade is low — what's the realistic commute time and amenity access for the typical tenant pool here? Any planned neighborhood developments (good or bad) we should know about?
- What's the average days-on-market for RENTAL listings here right now (not sales)? A rising rental-DOM trend means longer vacancies and softer asking-rent achievability than the comps imply.
- What's the recent tenant-quality profile in this submarket — average credit score on applications, eviction rate, late-payment / NSF rate, and stable-employment percentage? A property-management company in the area should have these aggregated.
- How much new for-sale + rental construction is in the pipeline within 1–3 miles? Heavy new supply typically softens prices + rents 12–24 months out; constrained supply supports both.
Investment metrics
- 1% rule
- 0.29% ✗
- Cap rate
- 0.26%
- Cash-on-cash
- -21.55%
- DSCR
- 0.04
- GRM
- 28.4
CMA / ARV
- ARV (on-the-fly)
- $674,982
- Comps found
- 3
Show comp detail 3 sales within ~0.75 mi
| Address | Dist | Beds/Ba | Sqft | Sold | Price | $/sf | Match |
|---|---|---|---|---|---|---|---|
| 1176 Deerpath Ct | 0.58mi | 3/3.0 | 4,220 (-4%) | 18mo | $485,300 | $115 | 48 |
| 1181 Deerpath Ct | 0.55mi | 4/3.0 (+1) | 4,135 (-6%) | 10mo | $638,750 | $154 | 48 |
| 7208 Viscaya Dr | 0.47mi | 4/3.0 (+1) | 3,973 (-9%) | 23mo | $640,000 | $161 | 34 |
Match score weights: distance 35% · size 25% · config 20% · recency 20%. Top-matched comps best support the ARV.
Projected returns pro-forma
-3.0% appreciation · 3.0% rent growth · sell at horizon
- IRR
- -62.0%
- Equity multiple
- -0.72×
- Total profit
- $-327,730
- Equity at exit
- $101,375
- IRR
- —
- Equity multiple
- -1.97×
- Total profit
- $-564,927
- Equity at exit
- $58,785
Cash invested: $190,372 (down + closing). Projections, not guarantees.
Landlord ↔ Tenant lean methodology
- Overall (STATE)
- 43 Moderately Tenant-Leaning
- State Illinois
- 43 Moderately Tenant-Leaning · D+7
- County
- — inherits STATE
- City
- — inherits STATE
ZIP-level market 60020
- Home prices YoY
- -30.7%
- Active inventory
- 78
- Price-to-rent
- 28.4×
Monthly cashflow live
- Estimated rent
- $1,998 medium interval (Pro) →
- Mortgage (P&I)
- −$3,565
- Tax from tax record
- −$1,122 /mo · $13,465/yr
- Insurance
- −$283
- HOA
- −$27
- Vacancy / Maint / Mgmt
- −$420
- Net cashflow
- $-3,419
Break-even live
UW: 25.0% down · 7.5% · 30yr · 1.5% tax · 5.0% vac · 8.0% maint · 8.0% mgmt
Financing live
Cash to close
- Down payment
- $169,975
- Closing costs
- $20,397
- Reserves months
- —
- Total cash needed
- —
Loan-product check · same deal, 3 products live
Conventional
25% down · 7.5% · 30yr
- Down + closing
- —
- Monthly P&I
- —
- Monthly cashflow
- —
- DSCR
- —
- Eligible?
- —
Personal DTI + credit; lowest rate.
DSCR
20% down · 8.5% · 30yr
- Down + closing
- —
- Monthly P&I
- —
- Monthly cashflow
- —
- DSCR
- —
- Eligible?
- —
No personal income docs; deal must DSCR.
Hard money
10% down · 12.0% · 12mo
- Down + closing
- —
- Monthly P&I
- —
- Monthly cashflow
- —
- DSCR
- —
- Eligible?
- —
Short-term bridge; refi at stabilization.
HOA detail
- Monthly dues
- $27 · $324/yr
Listing history 26 events
-
2026-06-18days on market $679,900 Active 26 DOM
-
2026-06-17days on market $679,900 Active 25 DOM
-
2026-06-16days on market $679,900 Active 24 DOM
-
2026-06-15days on market $679,900 Active 23 DOM
-
2026-06-13days on market $679,900 Active 21 DOM
-
2026-06-09days on market $679,900 Active 17 DOM
-
2026-06-08days on market $679,900 Active 16 DOM
-
2026-06-07days on market $679,900 Active 15 DOM
-
2026-06-04pricedays on market $679,900 Active 12 DOM
-
2026-06-03days on market $689,900 Active 11 DOM
-
2026-06-02days on market $689,900 Active 10 DOM
-
2026-06-01days on market $689,900 Active 9 DOM
-
2026-05-31days on market $689,900 Active 8 DOM
-
2026-05-23$689,900 Active
-
2022-04-08historical
-
2022-03-17Active
-
2022-01-06historical
-
2021-11-13Active
-
2019-05-15soldstatus $282,500
-
2019-04-30soldstatus $282,500 Closed Sale
-
2019-03-21historical Contingent
-
2019-03-05$295,000 New
-
2019-03-05historical
-
2019-02-20New
-
2019-02-20historical
-
2018-09-21New
ⓘ Source: listings_history table (triggers on properties + properties_extension) + one-shot
backfill from property_details.listing_events for pre-trigger history.
Tax reassessment forecast IL · Partial reset (capped growth)
- Current annual tax
- $13,465 · $1,122/mo
- Projected year-2 tax
- $14,449 · $1,204/mo
- Expected delta
- +$985/yr (+$82/mo · 7.3%)
ⓘ Screening estimate from a state-policy table — verify with the county assessor before closing.
Climate risk First Street
- Flood 1/10 Low FEMA zone X (unshaded) · 0% chance over 30 yrs
- Wildfire 3/10 Moderate
- Heat 2/10 Low 7 d/yr ≥101°F today · 14 d/yr by 30 yrs out
- Wind 2/10 Low
- Air quality 2/10 Low 1 unhealthy d/yr today · 1 by 30 yrs out
Nearby sold comps map
Loading sold comps map…
Walkable amenities ~0.75 mi
Loading nearby amenities…
Taxation est. · year 1
- Rental income
- $23,979
- − Mortgage interest
- −$38,085
- − Property taxes
- −$13,465
- − Insurance
- −$3,400
- − Repairs & maintenance
- −$1,918
- − Management
- −$1,918
- − HOA
- −$324
- − Depreciation
- −$19,779
- Taxable loss
- −$54,910
- Est. tax savings @ 24.0%
- +$13,178
- After-tax cash flow
- $-27,852/yr
For passive investors: Depreciation is non-cash, so a rental often shows a tax loss while cash-flowing — sheltering income. Rental losses are passive: they offset passive income freely, and up to $25,000/yr can offset ordinary (W-2) income if you actively participate and your MAGI is under $100k (phasing out to $0 by $150k); unused losses carry forward. On sale, claimed depreciation is recaptured at up to 25%, and gains may owe capital-gains tax (a 1031 exchange can defer both). Figures are a year-1 estimate at your 24.0% rate — not tax advice; consult a CPA.
Schools (NCES district)
- District
- Grant Chsd 124
- NCES district ID
- 1717340
- Math proficiency
- 23% ▼ -9.00%
- Reading proficiency
- 27% ▼ -7.00%
- Median HH income
- $59,450
- Composite
- 22.95/100
- National rank
- #7989
- State rank
- #296 of 620 in IL
Livability — Fox Lake
- Score
- 74/100
- State rank
- #247
- US rank
- #4462
Category grades
Schools grade is shown separately in the Schools card above.
Census & demographics
- Census place
- Fox Lake, IL
- City population
- 10,846
- Population (ZIP)
- 10,846
Population outlook (Lake County) Hauer SSP2
- Today (2025)
- 700,217 people
- By 2030
- 693,290 · -1.0%
- By 2040
- 673,588 · -3.8%
- By 2050
- 643,556 · -8.1%
- By 2075
- 562,792 · -19.6%
- By 2100
- 457,715 · -34.6%
Race, ethnicity, and origin ACS 2023
- Neighborhood character
- Predominantly White (80%)
- Race & ethnicity
- White 80% Hispanic / Latino 12% Two or more races 10% Black 3%
- Hispanic origin (detail)
- Mexican 10% Puerto Rican 1%
- Common ancestry
- Romanian 15% Portuguese 2% Italian 2%
- Foreign-born
- 10% · Canada, South Korea
- Languages at home
- 87% English-only · Spanish 6% Russian/Polish/Slavic 3% Other Indo-European 1%
Political lean MEDSL · Lake
- 2024 margin
- Strong D (+20.8) · D 59.7% · R 38.9% · Other 1.4%
- 2008→2024 swing
- +1.1pp toward D · 2008: 19.6pp · 2024: 20.8pp
- All cycles
- 2024: D+20.8 2020: D+24.1 2016: D+20.3 2012: D+8.1 2008: D+19.6
Not yet ingested
- Civics
- —
Market trends
- HPI YoY
- ▼ -97.19%
- Current HPI
- 219.6301
- Rent YoY
- —
- Metro
- —
- State GDP YoY
- ▲ 1.59%
- F500 in state
- 60
Industry mix (Fortune 500 HQ in IL)
| Industry | F500 HQs | Revenue |
|---|---|---|
| Insurance | 4 | $201B |
|
||
| Consumer Goods | 4 | $87B |
|
||
| Industrial Machinery | 3 | $64B |
|
||
| Healthcare | 2 | $55B |
|
||
| Retail / Pharmacy | 1 | $148B |
|
||
| Agriculture / Food | 1 | $86B |
|
||
Price history
+133.9% since first listed13 events — show timeline
- 2026-05-23 Listed $689,900 MRED as Distributed by MLS Grid
- 2022-04-08 Listing Removed — MRED as Distributed by MLS Grid
- 2022-03-17 Listed — MRED as Distributed by MLS Grid
- 2022-01-06 Listing Removed — MRED as Distributed by MLS Grid
- 2021-11-13 Listed — MRED as Distributed by MLS Grid
- 2019-05-15 Sold (Public Records) $282,500 Public Records
- 2019-04-30 Sold (MLS) $282,500 MRED as Distributed by MLS Grid
- 2019-03-21 Contingent — MRED as Distributed by MLS Grid
- 2019-03-05 Listing Removed — MRED as Distributed by MLS Grid
- 2019-03-05 Listed $295,000 MRED as Distributed by MLS Grid
- 2019-02-20 Listing Removed — MRED as Distributed by MLS Grid
- 2019-02-20 Listed — MRED as Distributed by MLS Grid
- 2018-09-21 Listed — MRED as Distributed by MLS Grid
Property tax history
+2.1%/yrLatest (2024): $13,465 · +4.7% YoY. Source: county tax records.
Cash-flow waterfall
monthlySold comps — $/sqft
last 12 mo · ≤1 miLoading sold comps…