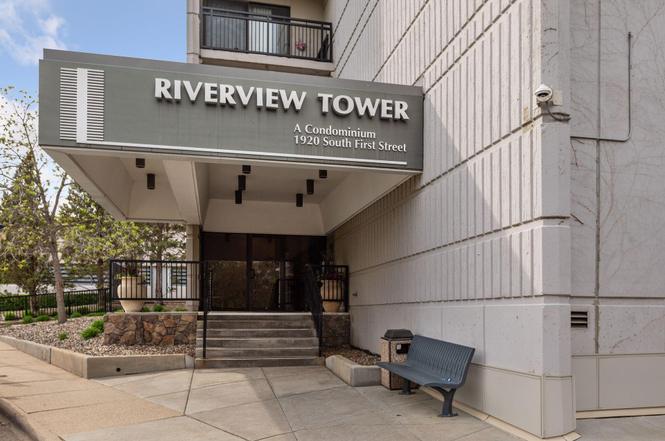
1920 S 1st St #1302
Minneapolis, MN 55454
$85,000D
2 bd · 2.0 ba ·
1,032 sqft ·
Built 1973
· Condo
· Pending
· 46 DOM
Cashflow @ list (25.0% down · 7.5%)
Estimated rent
$1,955/mo
Mortgage (P&I)
−$446
Tax + insurance
−$157
HOA
−$1,116
Vac / Maint / Mgmt
−$411
Net cashflow
$-174/mo
Annual
$-2,091/yr
Cap rate
3.83%
Cash-on-cash
-8.78%
DSCR
0.61
1% rule
2.30%
Cash to close
$23,800
Investor read
- This is a 2-bed/2.0-bath condo listed at $85k.
- At list price, monthly cash flow is $-174 ($-2k/yr) — negative.
- To cash-flow at today's rent, offer at most $54k (36.2% below list).
- Meets the 1% rule at list price ($2k rent vs $85k).
- It's been on market 46 days — a 3% lower offer ($82k) is reasonable based on typical stale-listing flexibility.
- Recommended offer: $54k (36.2% below list) — sets the bar for cash-flow.
- In year one you build about $2k of equity ($588 loan paydown + $1k appreciation (1.3% local appreciation)).
- Location reads 78/100 on livability (#110 in MN, #2,525 nationally) — a middle-class / working-renter tenant base. Strengths: amenities A+, commute A+, housing A+; Watch: cost of living C-, crime F.
- Minneapolis Public School District (urban): math 35% / reading 46% proficiency, ranked #217 of 301 in MN (top 72%) — families likely to look elsewhere, expect single-tenant / working-renter base with shorter leases.
- Watch-outs: HOA is 57% of rent.
- Market conditions: 9 active listings in the ZIP; 40 comparable units currently listed for rent nearby; rentals at typical pace (median 14d on market — plan ~3-4 weeks tenant-placement turnaround); lower-income renter base — watch delinquency; 4,651 units permitted in Hennepin County in 2024 (2,443 in 5+ unit buildings).
- Hennepin County population projected at +30% by 2050 — long-run rental-demand tailwind backs the buy-and-hold thesis.
- 4 sale attempts since 34y ago with the ask held roughly flat each time — persistent listings suggest the price (not the market) is what's stuck; bring a comps-based counter.
- Current owner paid $36k; list at $85k implies a 136% gain — meaningful room to come down on a strong offer.
- Cap rate 3.8% vs local median 3.1% in Minneapolis — meaningfully above typical; check what's discounted (condition, days-on-market, listing class) to confirm the premium yield is real.
- At $1,955/mo this rent would consume 102% of the median local household income ($23k/yr) (locally 800% of renters already pay >50% of income on rent) — very limited rent-growth headroom before tenants either downsize or default.
Questions for listing agent
- What do current leases actually rent for vs. the listed asking? Can we see a recent rent roll and the last 12 months of T-12 income?
- It's been on market 46 days. Have you received any prior offers? Is the seller open to a 36% concession, seller financing, or rate buy-down credit?
- Built in 1973 — when were the roof, HVAC, electrical panel, plumbing, and water heater last replaced?
- What does the HOA fee cover, when was the last increase, and are there any pending special assessments or reserve-fund shortfalls?
- Any open or pending special assessments — roof, HVAC, plumbing, elevator, façade? What's the per-unit balance and payoff schedule, and is the seller paying it off at close or rolling it to the buyer?
- Is there a deadline driving the sale (1031 exchange, divorce, estate, relocation)? That informs how much negotiation room exists.
- Crime grade is F in this area — have there been break-ins, vandalism, or insurance claims at this property in the last 3 years? What carrier currently insures it and at what premium?
- The area grade is low — what's the realistic commute time and amenity access for the typical tenant pool here? Any planned neighborhood developments (good or bad) we should know about?
CashFlowRE · CFR-PX9DZHAV2BREE2
· Data 6 days ago
cashflowre.app · 2026-05-29