1920 S 1st St #1302 · Minneapolis, MN
Flood risk 1/10 · Minimal
- FEMA flood zone
- X (unshaded)
- Chance of flooding over 30 yrs
- 0.0%
- Est. flood insurance / yr
- $507 – $1,088
Fire risk 1/10 · Minimal
- Est. fire insurance / yr
- $888 – $1,650
Heat risk 2/10 · Minimal
- Hot days now (above 99°F)
- 7 days/yr
- Hot days in 30 yrs
- 14 days/yr
Wind risk 2/10 · Minimal
- Chance of severe wind over 30 yrs
- —
Air-quality risk 2/10 · Minimal
- Unhealthy air days now
- 1 days/yr
- Unhealthy air days in 30 yrs
- 1 days/yr
Risk factors via First Street. Map © Google.
Why this score? — see what drove the D grade
The composite is a weighted blend of 9 inputs, each scored 0–100. Each bar is that input's sub-score; the figure is the points it added to the 100-point composite (weight × sub-score).
- 1% rule +10.0/10.0
- ARV discount +7.5/15.0
- Cash flow +5.7/30.0
- Appreciation +5.6/10.0
- Livability +3.9/5.0
- Schools +3.5/10.0
- Rent growth +2.5/5.0
- Condition / age +2.5/5.0
- DSCR +0.1/10.0
$85,000
🖨 Deal sheet 📄 Offer letter ✓ Due diligence
Listing remarks
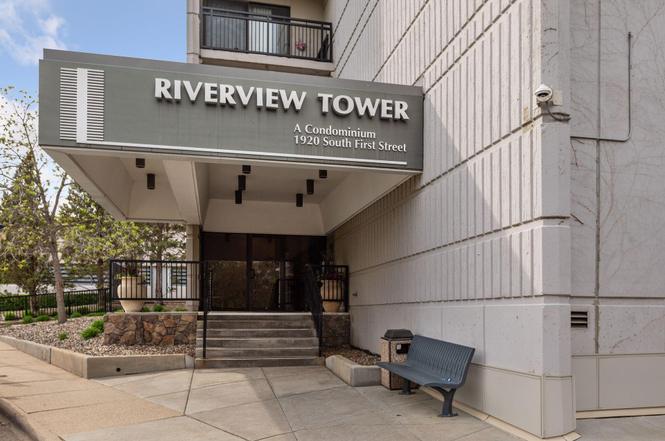
This 2 bedroom, 2 full bath unit is on the 13th floor of the Riverview Towers, with incredible views of the Stone Arch Bridge and US Bank Stadium. At night the downtown glows and you can enjoy it all. This unit is an opportunity for someone to do a refresh and make it their own. Walking distance to U of M West Bank Campus, secure building with 24 hour security: Building has heated indoor pool, hot tub, sauna, exercise room, hobby room, community room with full kitchen, game room, tennis/pickleball court, outdoor patio with grills, laundry room, storage lockers and several options for underground or surface parking. HOA fee covers everything: Heat, electric, gas, A/C, Internet, Cable, Water/
Key facts
- Hot tub
- Secure building
- Sauna
Tags
Neighborhood map
What this means for you Summary
Snapshot
- This is a 2-bed/2.0-bath condo listed at $85k.
Deal economics
- At list price, monthly cash flow is $-174 ($-2k/yr) — negative.
- To cash-flow at today's rent, offer at most $54k (36.2% below list).
- Meets the 1% rule at list price ($2k rent vs $85k).
- Recommended offer: $54k (36.2% below list) — sets the bar for cash-flow.
- Cap rate 3.8% vs local median 3.1% in Minneapolis — meaningfully above typical; check what's discounted (condition, days-on-market, listing class) to confirm the premium yield is real.
Location & tenants
- Location reads 78/100 on livability (#110 in MN, #2,525 nationally) — a middle-class / working-renter tenant base. Strengths: amenities A+, commute A+, housing A+; Watch: cost of living C-, crime F.
- Minneapolis Public School District (urban): math 35% / reading 46% proficiency, ranked #217 of 301 in MN (top 72%) — families likely to look elsewhere, expect single-tenant / working-renter base with shorter leases.
- Market conditions: 9 active listings in the ZIP; 40 comparable units currently listed for rent nearby; rentals at typical pace (median 14d on market — plan ~3-4 weeks tenant-placement turnaround); lower-income renter base — watch delinquency; 4,651 units permitted in Hennepin County in 2024 (2,443 in 5+ unit buildings).
- At $1,955/mo this rent would consume 102% of the median local household income ($23k/yr) (locally 800% of renters already pay >50% of income on rent) — very limited rent-growth headroom before tenants either downsize or default.
Forward outlook
- In year one you build about $2k of equity ($588 loan paydown + $1k appreciation (1.3% local appreciation)).
- Hennepin County population projected at +30% by 2050 — long-run rental-demand tailwind backs the buy-and-hold thesis.
Negotiation context
- It's been on market 46 days — a 3% lower offer ($82k) is reasonable based on typical stale-listing flexibility.
- 4 sale attempts since 34y ago with the ask held roughly flat each time — persistent listings suggest the price (not the market) is what's stuck; bring a comps-based counter.
- Current owner paid $36k; list at $85k implies a 136% gain — meaningful room to come down on a strong offer.
Risks & watch-outs
- Watch-outs: HOA is 57% of rent.
Questions for the listing agent
- What do current leases actually rent for vs. the listed asking? Can we see a recent rent roll and the last 12 months of T-12 income?
- It's been on market 46 days. Have you received any prior offers? Is the seller open to a 36% concession, seller financing, or rate buy-down credit?
- Built in 1973 — when were the roof, HVAC, electrical panel, plumbing, and water heater last replaced?
- What does the HOA fee cover, when was the last increase, and are there any pending special assessments or reserve-fund shortfalls?
- Any open or pending special assessments — roof, HVAC, plumbing, elevator, façade? What's the per-unit balance and payoff schedule, and is the seller paying it off at close or rolling it to the buyer?
- Is there a deadline driving the sale (1031 exchange, divorce, estate, relocation)? That informs how much negotiation room exists.
- Crime grade is F in this area — have there been break-ins, vandalism, or insurance claims at this property in the last 3 years? What carrier currently insures it and at what premium?
- The area grade is low — what's the realistic commute time and amenity access for the typical tenant pool here? Any planned neighborhood developments (good or bad) we should know about?
- What's the average days-on-market for RENTAL listings here right now (not sales)? A rising rental-DOM trend means longer vacancies and softer asking-rent achievability than the comps imply.
- What's the recent tenant-quality profile in this submarket — average credit score on applications, eviction rate, late-payment / NSF rate, and stable-employment percentage? A property-management company in the area should have these aggregated.
- How much new apartment / multifamily construction is in the pipeline within 1–3 miles? Heavy new supply (>2% of stock underway) typically softens rents 12–24 months out; light construction supports rent growth.
Investment metrics
- 1% rule
- 2.30% ✓
- Cap rate
- 3.83%
- Cash-on-cash
- -8.78%
- DSCR
- 0.61
- GRM
- 3.6
CMA / ARV
No comps found within radius.
Projected returns pro-forma
1.28% appreciation · 3.0% rent growth · sell at horizon
- IRR
- -6.2%
- Equity multiple
- 0.68×
- Total profit
- $-7,614
- Equity at exit
- $30,260
- IRR
- -0.2%
- Equity multiple
- 0.98×
- Total profit
- $-558
- Equity at exit
- $41,191
Cash invested: $23,800 (down + closing). Projections, not guarantees.
Landlord ↔ Tenant lean methodology
- Overall (CITY)
- 34 Tenant-Leaning
- State Minnesota
- 46 Balanced · D+2
- County
- — inherits STATE
- City Minneapolis
- 34 Tenant-Leaning · D+50
ZIP-level market 55454
- Home prices YoY
- 0.6%
- Active inventory
- 9
- Price-to-rent
- 3.6×
Monthly cashflow live
- Estimated rent
- $1,955 high interval (Pro) →
- Mortgage (P&I)
- −$446
- Tax from tax record
- −$121 /mo · $1,458/yr
- Insurance
- −$35
- HOA
- −$1,116
- Vacancy / Maint / Mgmt
- −$411
- Net cashflow
- $-174
Break-even live
UW: 25.0% down · 7.5% · 30yr · 1.5% tax · 5.0% vac · 8.0% maint · 8.0% mgmt
Financing live
Cash to close
- Down payment
- $21,250
- Closing costs
- $2,550
- Reserves months
- —
- Total cash needed
- —
Loan-product check · same deal, 3 products live
Conventional
25% down · 7.5% · 30yr
- Down + closing
- —
- Monthly P&I
- —
- Monthly cashflow
- —
- DSCR
- —
- Eligible?
- —
Personal DTI + credit; lowest rate.
DSCR
20% down · 8.5% · 30yr
- Down + closing
- —
- Monthly P&I
- —
- Monthly cashflow
- —
- DSCR
- —
- Eligible?
- —
No personal income docs; deal must DSCR.
Hard money
10% down · 12.0% · 12mo
- Down + closing
- —
- Monthly P&I
- —
- Monthly cashflow
- —
- DSCR
- —
- Eligible?
- —
Short-term bridge; refi at stabilization.
Rent comps 40 comps
| Address | Beds | Baths | Sqft | Rent | $/sqft | DOM | Units | Dist |
|---|---|---|---|---|---|---|---|---|
| 1800 Washington Ave S Minneapolis, MN | 2.0 | 1.0–2.0 | 674 | $2,310 | $3.43 | 2d | 23 | 0.19mi |
| 1000 University Ave SE Minneapolis, MN | 2.0–4.0 | 1.0–2.0 | 1136 | $1,880 | $1.65 | 24d | 9 | 0.40mi |
| 212 10th Ave S Minneapolis, MN | 3.0 | 1.0–2.5 | 1490 | $6,415 | $4.31 | 1d | 10 | 0.46mi |
| 708 University Ave SE Minneapolis, MN | 1.0 | 1.0 | 775 | $1,100 | $1.42 | 4d | 3 | 0.48mi |
| 701 University Ave SE Minneapolis, MN | 1.0 | 1.0 | 750 | $1,099 | $1.47 | 4d | 2 | 0.52mi |
| 1215 4th St SE Unit 1 Minneapolis, MN | 3.0 | 1.0 | 1050 | $1,600 | $1.52 | 43d | 1 | 0.52mi |
| 600 University Ave SE Minneapolis, MN | 1.0–2.0 | 1.0 | 600 | $1,617 | $2.69 | 2d | 13 | 0.54mi |
| 2015 Riverside Ave Minneapolis, MN | 1.0–2.0 | 1.0 | 886 | $1,720 | $1.94 | 1d | 9 | 0.56mi |
| 425 13th Ave SE Minneapolis, MN | 1.0–4.0 | 1.0–2.0 | 827 | $1,497 | $1.81 | 2d | 36 | 0.57mi |
| 711 4th St SE Minneapolis, MN | 4.0 | 1.0–2.0 | 1667 | $2,000 | $1.20 | 43d | 51 | 0.57mi |
| 414 7th Ave SE Minneapolis, MN | 2.0 | 1.0 | 1056 | $1,400 | $1.33 | 14d | 24 | 0.58mi |
| 811 Washington Ave S Minneapolis, MN | 1.0–2.0 | 1.0–2.0 | 862 | $3,099 | $3.60 | 19d | 9 | 0.59mi |
| 326 6th Ave SE Minneapolis, MN | 2.0 | 1.0 | 700 | $1,295 | $1.85 | 43d | 1 | 0.60mi |
| 240 Chicago Ave Minneapolis, MN | 2.0 | 1.0–2.0 | 825 | $3,036 | $3.68 | 2d | 11 | 0.63mi |
| 205 Park Ave Minneapolis, MN | 1.0–2.0 | 1.0–2.0 | 859 | $3,158 | $3.68 | 7d | 5 | 0.65mi |
| 1010 S 7th St Minneapolis, MN | 2.0 | 1.0–2.0 | 834 | $2,725 | $3.27 | 43d | 1 | 0.67mi |
| 700 S 4th St Minneapolis, MN | 2.0 | 1.0–2.0 | 897 | $3,995 | $4.45 | 1d | 26 | 0.69mi |
| 240 Park Ave Minneapolis, MN | 1.0–2.0 | 1.0–2.0 | 1047 | $3,875 | $3.70 | 3d | 2 | 0.70mi |
| 225 Portland Ave Minneapolis, MN | 2.0 | 1.0–2.0 | 837 | $3,420 | $4.08 | 3d | 70 | 0.71mi |
| 250 Park Ave #215 Minneapolis, MN | 1.0 | 1.0 | 961 | $2,350 | $2.45 | 14d | 1 | 0.72mi |
| 621 6th St SE Unit 2 Minneapolis, MN | 2.0 | 1.0 | 1100 | $2,000 | $1.82 | 43d | 1 | 0.74mi |
| 621 6th St SE Unit 1 Minneapolis, MN | 2.0 | 1.0 | 1100 | $2,000 | $1.82 | 43d | 1 | 0.74mi |
| 515 5th Ave SE Minneapolis, MN | 3.0 | 1.0 | 1200 | $1,995 | $1.66 | 43d | 1 | 0.77mi |
| 721 10th Ave SE Unit B Minneapolis, MN | 3.0 | 1.0 | 1100 | $1,850 | $1.68 | 24d | 1 | 0.78mi |
| 250 Portland Ave Minneapolis, MN | 1.0–2.0 | 1.0–2.0 | 902 | $3,372 | $3.74 | 2d | 11 | 0.78mi |
| 612 7th St SE Minneapolis, MN | 2.0 | 1.0 | 800 | $1,650 | $2.06 | 24d | 1 | 0.79mi |
| 200 University Ave SE Minneapolis, MN | 3.0 | 1.0–3.0 | 1554 | $5,957 | $3.83 | 1d | 25 | 0.79mi |
| 1901 Minnehaha Ave Minneapolis, MN | 2.0 | 1.0 | 840 | $1,550 | $1.85 | 14d | 1 | 0.81mi |
| 410 6th St SE Minneapolis, MN | 1.0–2.0 | 1.0 | 850 | $1,600 | $1.88 | 14d | 1 | 0.81mi |
| 1423 11th Ave S Minneapolis, MN | 1.0–2.0 | 1.0 | 818 | $1,800 | $2.20 | 2d | 29 | 0.83mi |
| 808 13th Ave SE Apt 3 Minneapolis, MN | 2.0 | 1.0 | 950 | $1,450 | $1.53 | 24d | 1 | 0.85mi |
| 814 11th Ave SE Apt 204 Minneapolis, MN | 1.0 | 1.0 | 700 | $1,100 | $1.57 | 43d | 1 | 0.85mi |
| 814 11th Ave SE Unit 203 Minneapolis, MN | 1.0 | 1.0 | 700 | $1,100 | $1.57 | 2d | 1 | 0.85mi |
| 815 13th Ave SE Minneapolis, MN | 1.0–4.0 | 1.0–2.0 | 1171 | $1,583 | $1.35 | 43d | 46 | 0.86mi |
| 2520 S 8th St Minneapolis, MN | 2.0 | 1.0–2.0 | 721 | $2,457 | $3.41 | 1d | 9 | 0.86mi |
| 2520 S 8th St Minneapolis, MN | 2.0 | 1.0–2.0 | 721 | $2,445 | $3.39 | 17d | 11 | 0.86mi |
| 511 S 4th St Minneapolis, MN | 2.0 | 1.0–2.0 | 882 | $2,945 | $3.34 | 2d | 11 | 0.89mi |
| 619 SE 8th St Minneapolis, MN | 2.0 | 2.0 | 1043 | $1,800 | $1.73 | 14d | 1 | 0.89mi |
| 902 SE 9th Ave Unit 902 Minneapolis, MN | 3.0 | 1.0 | 1100 | $1,800 | $1.64 | 43d | 1 | 0.90mi |
| 815 SE 9th St Minneapolis, MN | 1.0–4.0 | 1.0–4.0 | 1149 | $1,938 | $1.69 | 2d | 13 | 0.90mi |
HOA detail condo
- Monthly dues
- $1,116 · $13,392/yr
- Likely covers
- watergaselectricinternetcablepoolsecurity
- Assessments
- None detected in remarks — confirm with the listing agent.
Listing history 11 events
-
2025-10-24status Pending
-
2025-10-04historical Contingent - Inspection
-
2025-09-08$85,000 Active
-
1996-08-23soldstatus $36,075
-
1994-08-01soldstatus $49,000
-
1994-07-10historical
-
1994-05-25$54,900
-
1993-11-30historical
-
1993-04-25$59,900
-
1993-01-10historical
-
1992-08-10$59,900
ⓘ Source: listings_history table (triggers on properties + properties_extension) + one-shot
backfill from property_details.listing_events for pre-trigger history.
Tax reassessment forecast MN · Partial reset (capped growth)
- Current annual tax
- $1,458 · $121/mo
- Projected year-2 tax
- $1,458 · $121/mo
- Expected delta
- $0/yr ($0/mo · 0.0%)
ⓘ Screening estimate from a state-policy table — verify with the county assessor before closing.
Climate risk First Street
- Flood 1/10 Low FEMA zone X (unshaded) · 0% chance over 30 yrs
- Wildfire 1/10 Low
- Heat 2/10 Low 7 d/yr ≥99°F today · 14 d/yr by 30 yrs out
- Wind 2/10 Low
- Air quality 2/10 Low 1 unhealthy d/yr today · 1 by 30 yrs out
Nearby sold comps map
Loading sold comps map…
Walkable amenities ~0.75 mi
Loading nearby amenities…
Taxation est. · year 1
- Rental income
- $23,459
- − Mortgage interest
- −$4,761
- − Property taxes
- −$1,458
- − Insurance
- −$425
- − Repairs & maintenance
- −$1,877
- − Management
- −$1,877
- − HOA
- −$13,392
- − Depreciation
- −$2,473
- Taxable loss
- −$2,803
- Est. tax savings @ 24.0%
- +$673
- After-tax cash flow
- $-1,418/yr
For passive investors: Depreciation is non-cash, so a rental often shows a tax loss while cash-flowing — sheltering income. Rental losses are passive: they offset passive income freely, and up to $25,000/yr can offset ordinary (W-2) income if you actively participate and your MAGI is under $100k (phasing out to $0 by $150k); unused losses carry forward. On sale, claimed depreciation is recaptured at up to 25%, and gains may owe capital-gains tax (a 1031 exchange can defer both). Figures are a year-1 estimate at your 24.0% rate — not tax advice; consult a CPA.
Schools (NCES district)
- District
- Minneapolis Public School District
- NCES district ID
- 2721240
- Math proficiency
- 35% ▼ -7.00%
- Reading proficiency
- 46% ▼ -1.00%
- Median HH income
- $50,521
- Composite
- 34.92/100
- National rank
- #5067
- State rank
- #217 of 301 in MN
Livability — Minneapolis
- Score
- 78/100
- State rank
- #110
- US rank
- #2525
Category grades
Schools grade is shown separately in the Schools card above.
Census & demographics
- Census place
- Minneapolis, MN
- County
- Hennepin County · 1,150,272 people
- City population
- 417,555
- Metro
- Minneapolis-St. Paul-Bloomington, MN-WI
- Population (ZIP)
- 8,880
- Household income
- $23,100
- Rent vs Own
- Severe rent burden
- 800.0
Population outlook (Hennepin County) Hauer SSP2
- Today (2025)
- 1,405,227 people
- By 2030
- 1,492,650 · +6.2%
- By 2040
- 1,660,157 · +18.1%
- By 2050
- 1,823,498 · +29.8%
- By 2075
- 2,221,283 · +58.1%
- By 2100
- 2,509,976 · +78.6%
Race, ethnicity, and origin ACS 2023
- Neighborhood character
- Diverse neighborhood (Simpson 0.60)
- Race & ethnicity
- Black 58% White 25% Two or more races 7% Asian 6% Hispanic / Latino 4%
- Common ancestry
- Portuguese 3% Romanian 2% Italian 2%
- Foreign-born
- 39% · Canada, South Korea, China
- Languages at home
- 43% English-only · Arabic 3% Spanish 2% Other Asian/Pacific 2%
Political lean MEDSL · Hennepin
- 2024 margin
- Solid D (+42.6) · D 70.2% · R 27.5% · Other 2.3%
- 2008→2024 swing
- +14.0pp toward D · 2008: 28.6pp · 2024: 42.6pp
- All cycles
- 2024: D+42.6 2020: D+43.2 2016: D+35.3 2012: D+27.1 2008: D+28.6
Not yet ingested
- Civics
- —
Market trends
- HPI YoY
- ▲ 1.28%
- Current HPI
- 230.9924
- Rent YoY
- —
- Metro
- Minneapolis-St. Paul-Bloomington, MN-WI
- State GDP YoY
- ▲ 2.41%
- F500 in state
- 34
Industry mix (Fortune 500 HQ in MN)
| Industry | F500 HQs | Revenue |
|---|---|---|
| Healthcare | 2 | $407B |
|
||
| Retail | 2 | $150B |
|
||
| Consumer Goods | 2 | $32B |
|
||
| Industrial Machinery | 2 | $6B |
|
||
| Agriculture | 1 | $40B |
|
||
| Healthcare / Medical Devices | 1 | $32B |
|
||
Price history
+41.9% since first listed11 events — show timeline
- 2025-10-24 Pending — NORTHSTARMLS as Distributed by MLS Grid
- 2025-10-04 Contingent — NORTHSTARMLS as Distributed by MLS Grid
- 2025-09-08 Listed $85,000 NORTHSTARMLS as Distributed by MLS Grid
- 1996-08-23 Sold (Public Records) $36,075 Public Records
- 1994-08-01 Sold (MLS) $49,000 NORTHSTARMLS as Distributed by MLS Grid
- 1994-07-10 Listing Removed — NORTHSTARMLS as Distributed by MLS Grid
- 1994-05-25 Listed $54,900 NORTHSTARMLS as Distributed by MLS Grid
- 1993-11-30 Listing Removed — NORTHSTARMLS as Distributed by MLS Grid
- 1993-04-25 Listed $59,900 NORTHSTARMLS as Distributed by MLS Grid
- 1993-01-10 Listing Removed — NORTHSTARMLS as Distributed by MLS Grid
- 1992-08-10 Listed $59,900 NORTHSTARMLS as Distributed by MLS Grid
Property tax history
-0.3%/yrLatest (2025): $1,458 · -6.5% YoY. Source: county tax records.
Cash-flow waterfall
monthlySold comps — $/sqft
last 12 mo · ≤1 miLoading sold comps…